CompareTables, Pictographs, and Bar Graphs
Tables, Pictographs, and Bar Graphs: relationships and examples
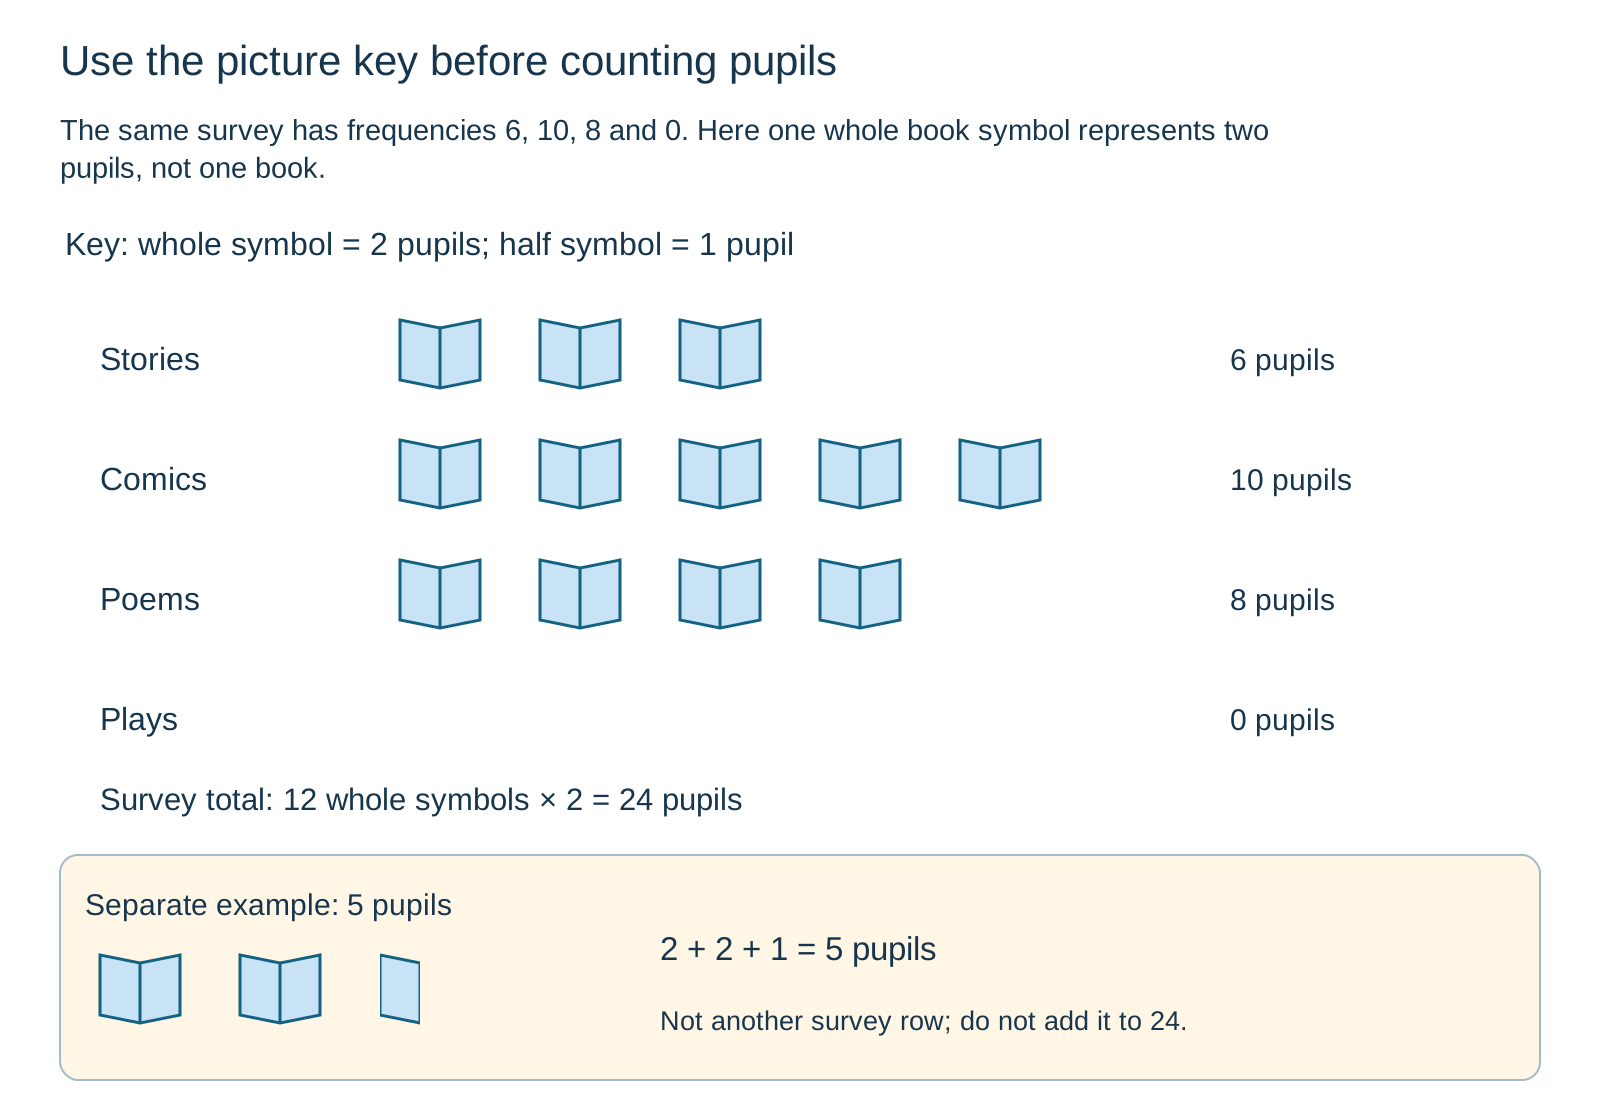
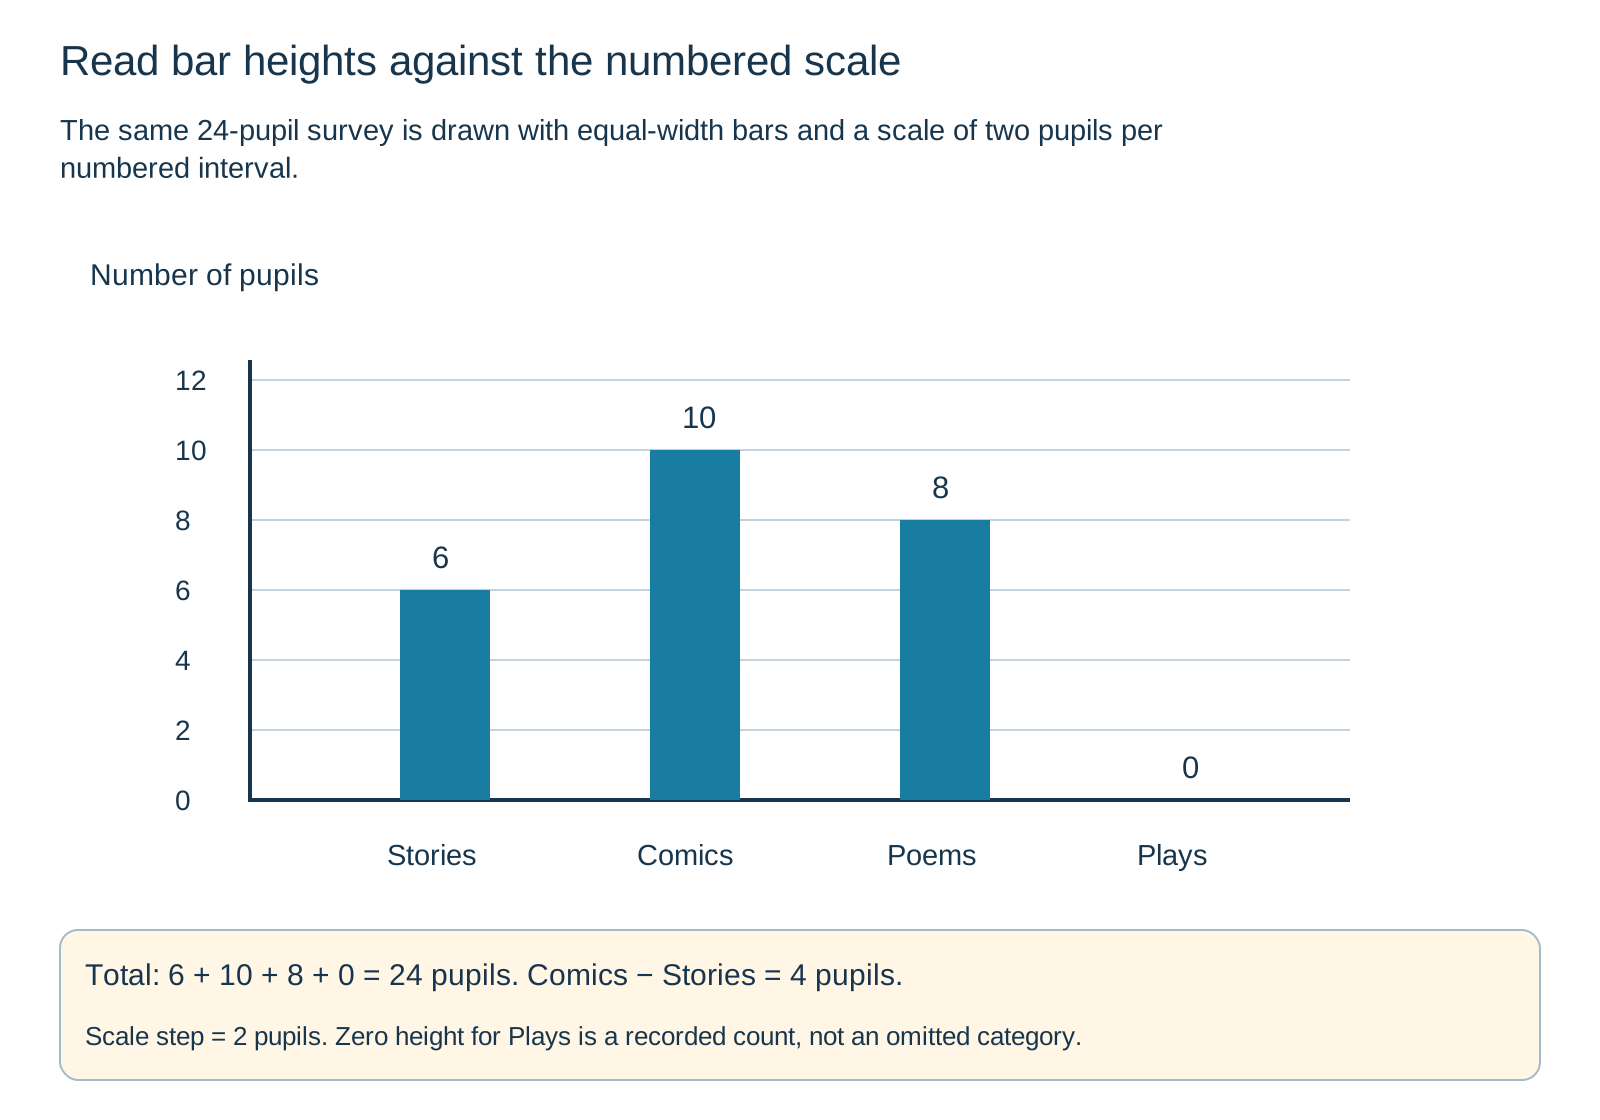
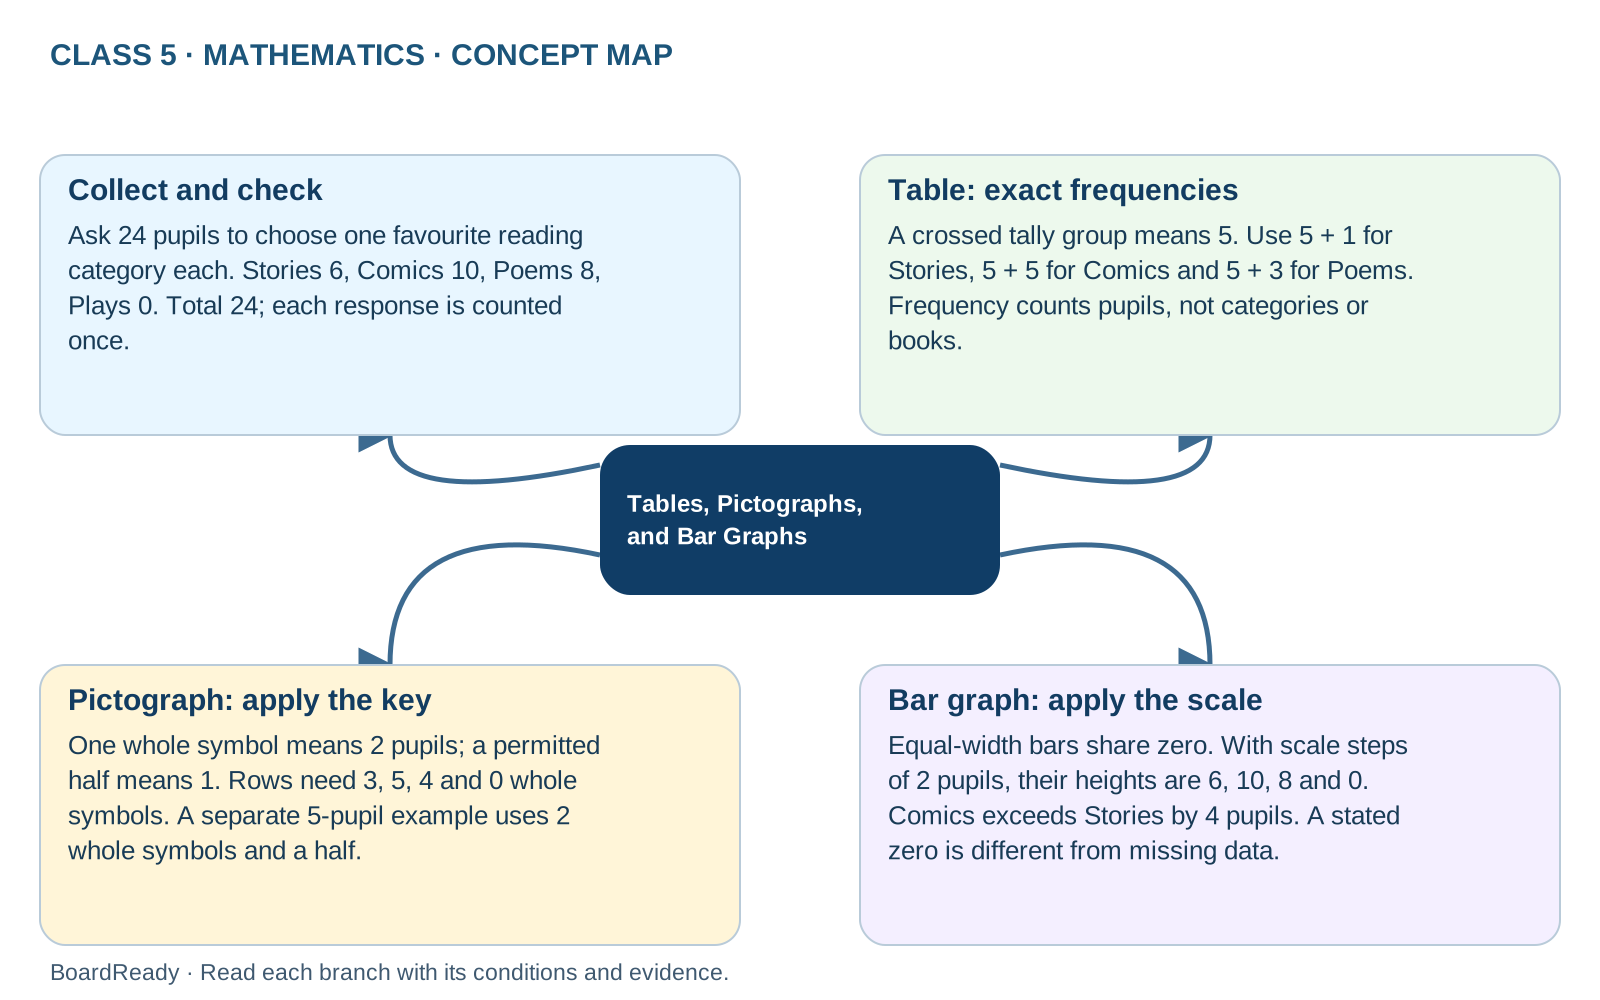
Follow one survey from counted responses to three displays, keeping the category meanings, frequencies and unit unchanged. Collect and check: Ask 24 pupils to choose one favourite reading category each. Stories 6, Comics 10, Poems 8, Plays 0. Total 24; each response is counted once. Table: exact frequencies: A crossed tally group means 5. Use 5 + 1 for Stories, 5 + 5 for Comics and 5 + 3 for Poems. Frequency counts pupils, not categories or books. Pictograph: apply the key: One whole symbol means 2 pupils; a permitted half means 1. Rows need 3, 5, 4 and 0 whole symbols. A separate 5-pupil example uses 2 whole symbols and a half. Bar graph: apply the scale: Equal-width bars share zero. With scale steps of 2 pupils, their heights are 6, 10, 8 and 0. Comics exceeds Stories by 4 pupils. A stated zero is different from missing data.Collect and check
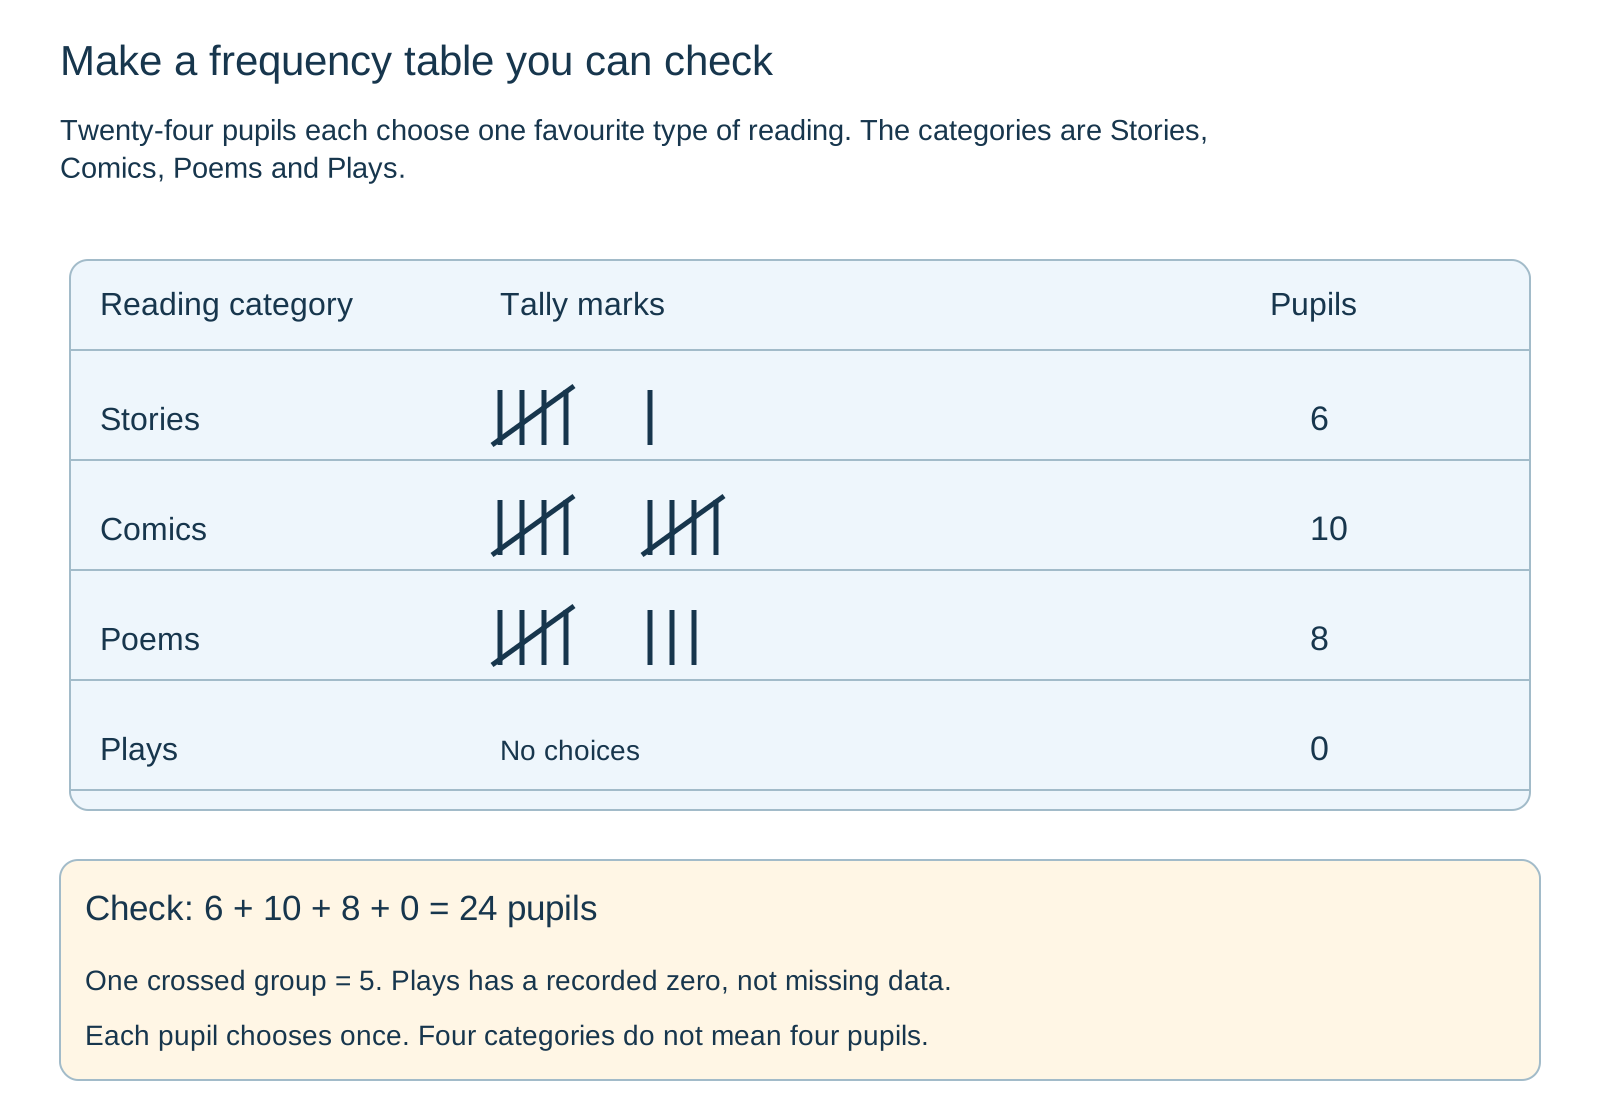
Ask 24 pupils to choose one favourite reading category each. Stories 6, Comics 10, Poems 8, Plays 0. Total 24; each response is counted once.Table: exact frequencies
A crossed tally group means 5. Use 5 + 1 for Stories, 5 + 5 for Comics and 5 + 3 for Poems. Frequency counts pupils, not categories or books.Check: Read the title, labels, unit and key or scale. Check that every display gives the same frequencies and total.