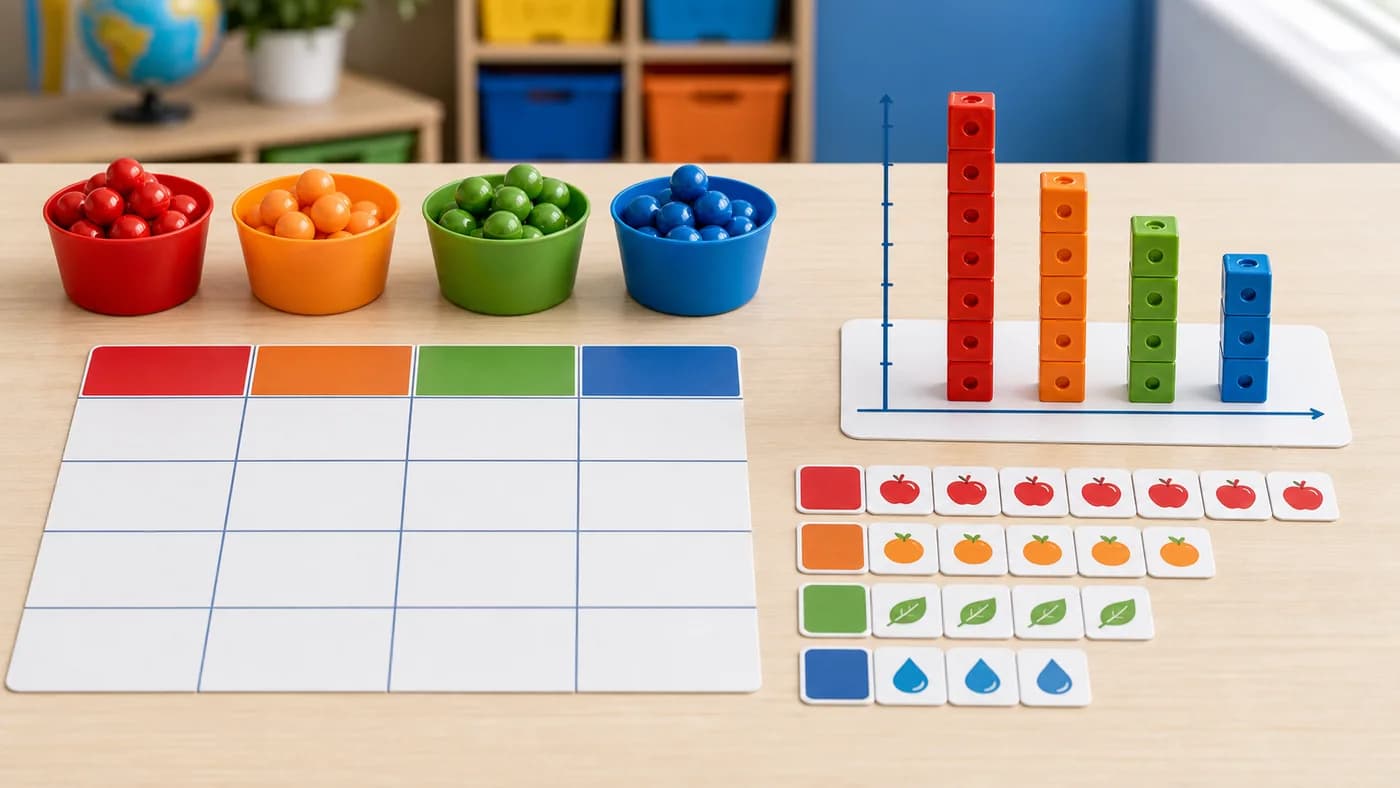
Labelled diagram
Bar graph parts
A labelled bar graph shows where to read values and categories.Exam cue: Use the graph scale, not just the visual height.
- 1Scale -> Value: controls
- 2Bar height -> Comparison: shows
Checking progress account…
Opening your study space…
Lesson
Organise data in tables, pictographs, and bar graphs, then read values accurately.
Learning objectives
Read data from tables and graph axes.
Use a pictograph key correctly.
Compare quantities shown in a bar graph.
Lesson
Ready to check what you remember?
Continue to revisionStudy path
Notes
Review the compact notes before moving into recall.
Open notesShowing 4 of 5 notes.
Diagrams
Practice
Choose one small set. The full bank opens only inside the practice session.
In this chapter
Now on Tables, Pictographs, and Bar Graphs. Next up: Data Interpretation.
Lesson progress
Save this lesson when done. Next: Data Interpretation.
Keep moving