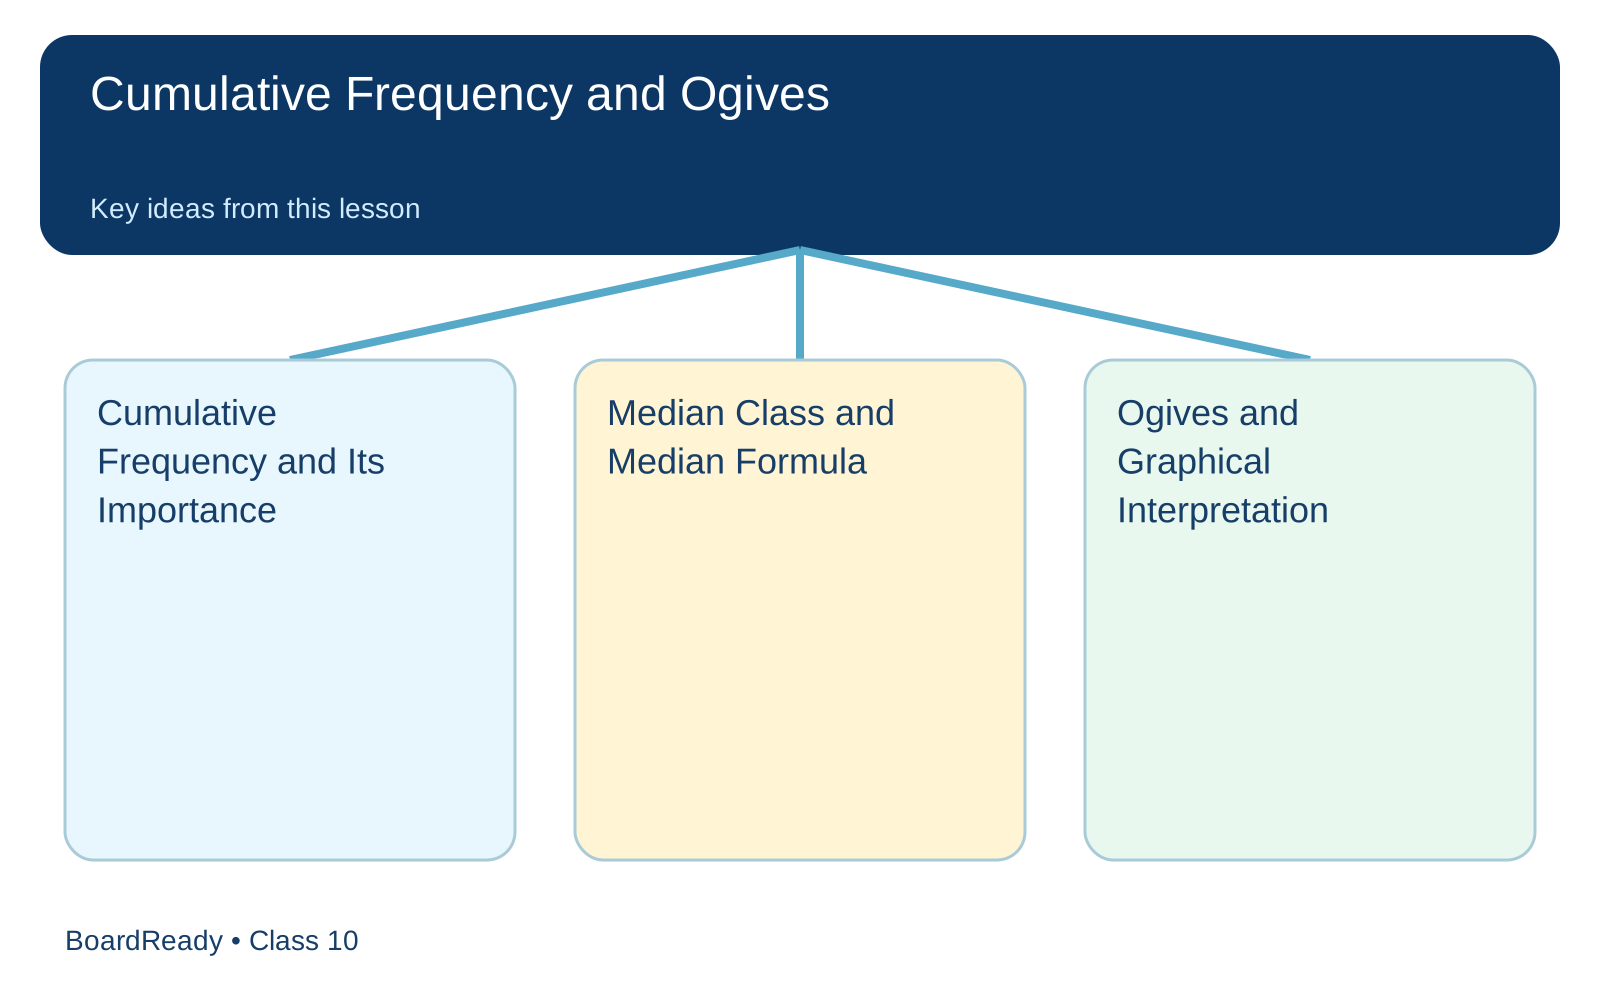
Comparison map
Checking progress account…
Opening your study space…
Checking progress account…
Opening your study space…
Construct and interpret ogives through six worked examples on plotting points, quartiles, percentages, decreasing curves, data checks and rounded class boundaries.
Learning goals
Visual learning
Lesson
Read the full lesson below, or jump to the section you need.
Method
Method
Method
Method
Method
Method
Ready to check what you remember?
Continue to revisionRevise
Practise
Start with a short MCQ set, write an answer, or combine both in a lesson test.
1781 MCQs · 1826 written questions. Each session opens a focused selection.
Lesson 5 of 9 · Statistics
Lesson progress
Save this lesson when done. Next: Histograms and Data Interpretation.
Lesson navigation