CompareData Representation and Averages
Data Representation and Averages: relationships and examples
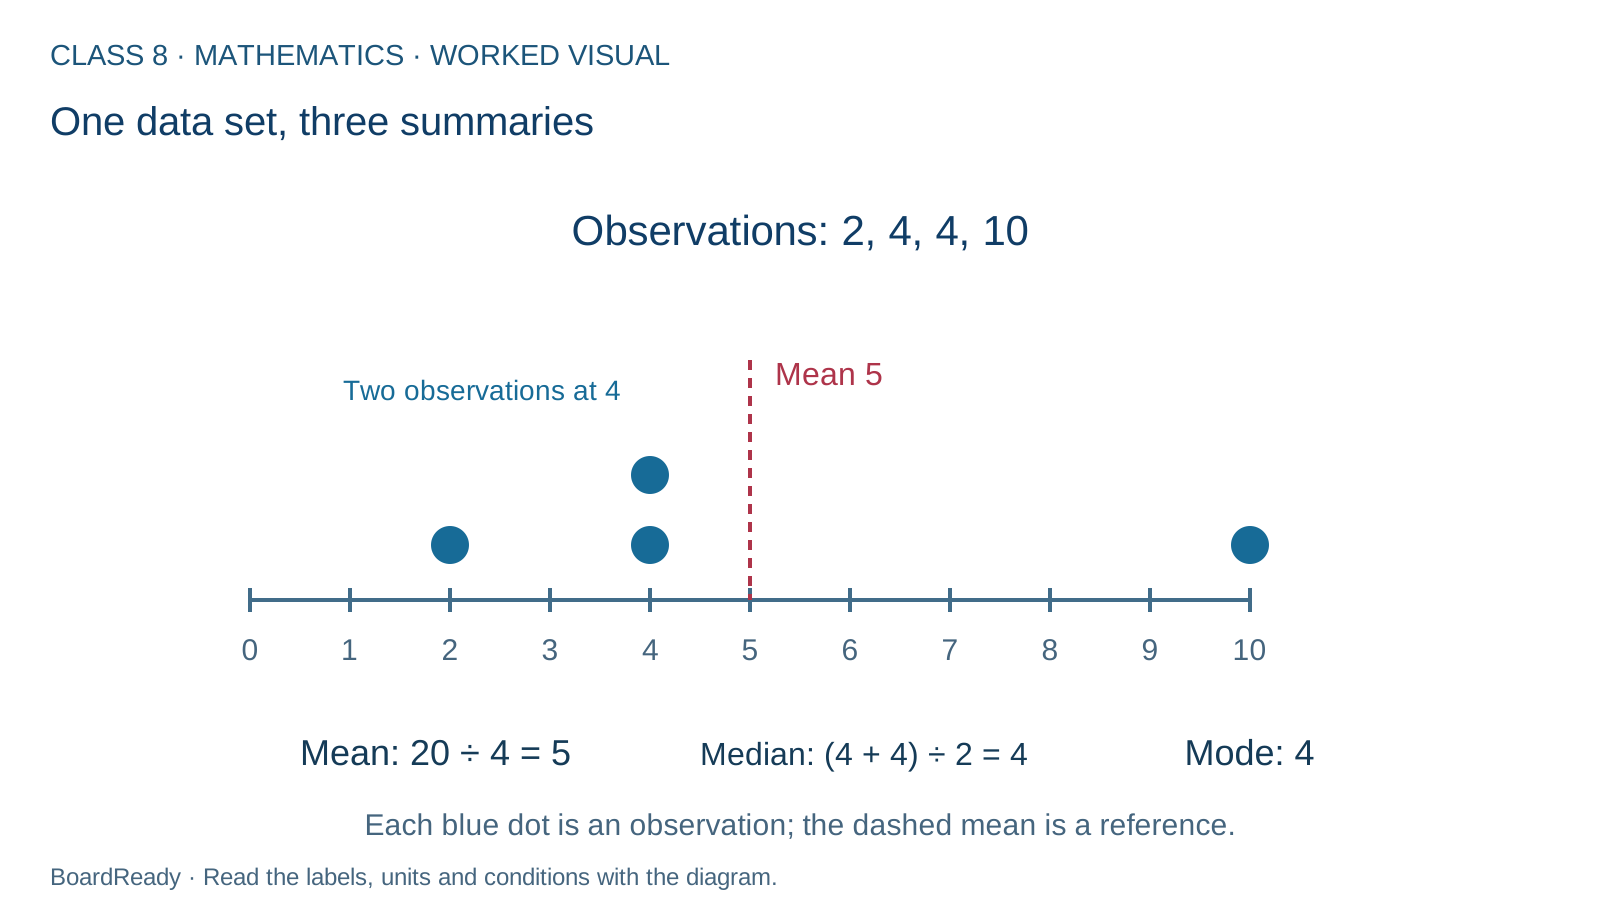
Connect a sorted dot plot with the mean, median and mode, and explain why the summaries can differ.Organise the data
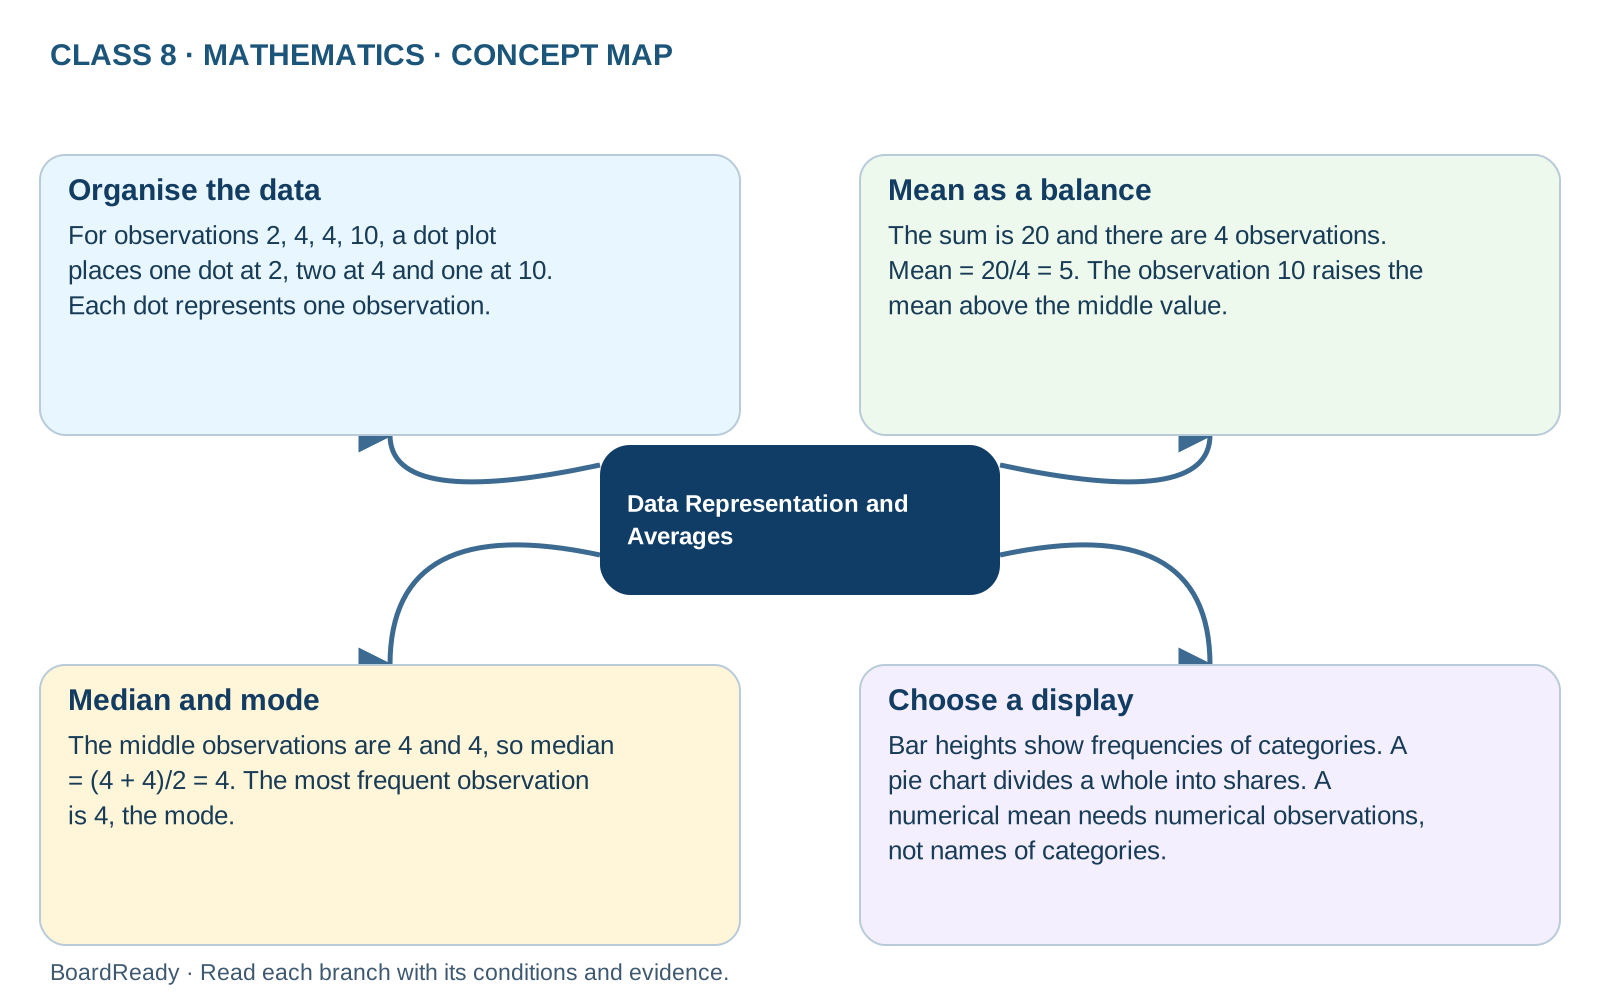
For observations 2, 4, 4, 10, a dot plot places one dot at 2, two at 4 and one at 10. Each dot represents one observation.Mean as a balance
The sum is 20 and there are 4 observations. Mean = 20/4 = 5. The observation 10 raises the mean above the middle value.Check: Sort observations before finding the median and include repetitions in the count.