Comparison map
Experimental Graphs and Errors: relationships and examples
Slope and intercept describe different parts of a measured trend.Exam cue: Connect the quantities with the stated conditions; use the worked visual to check the explanation.
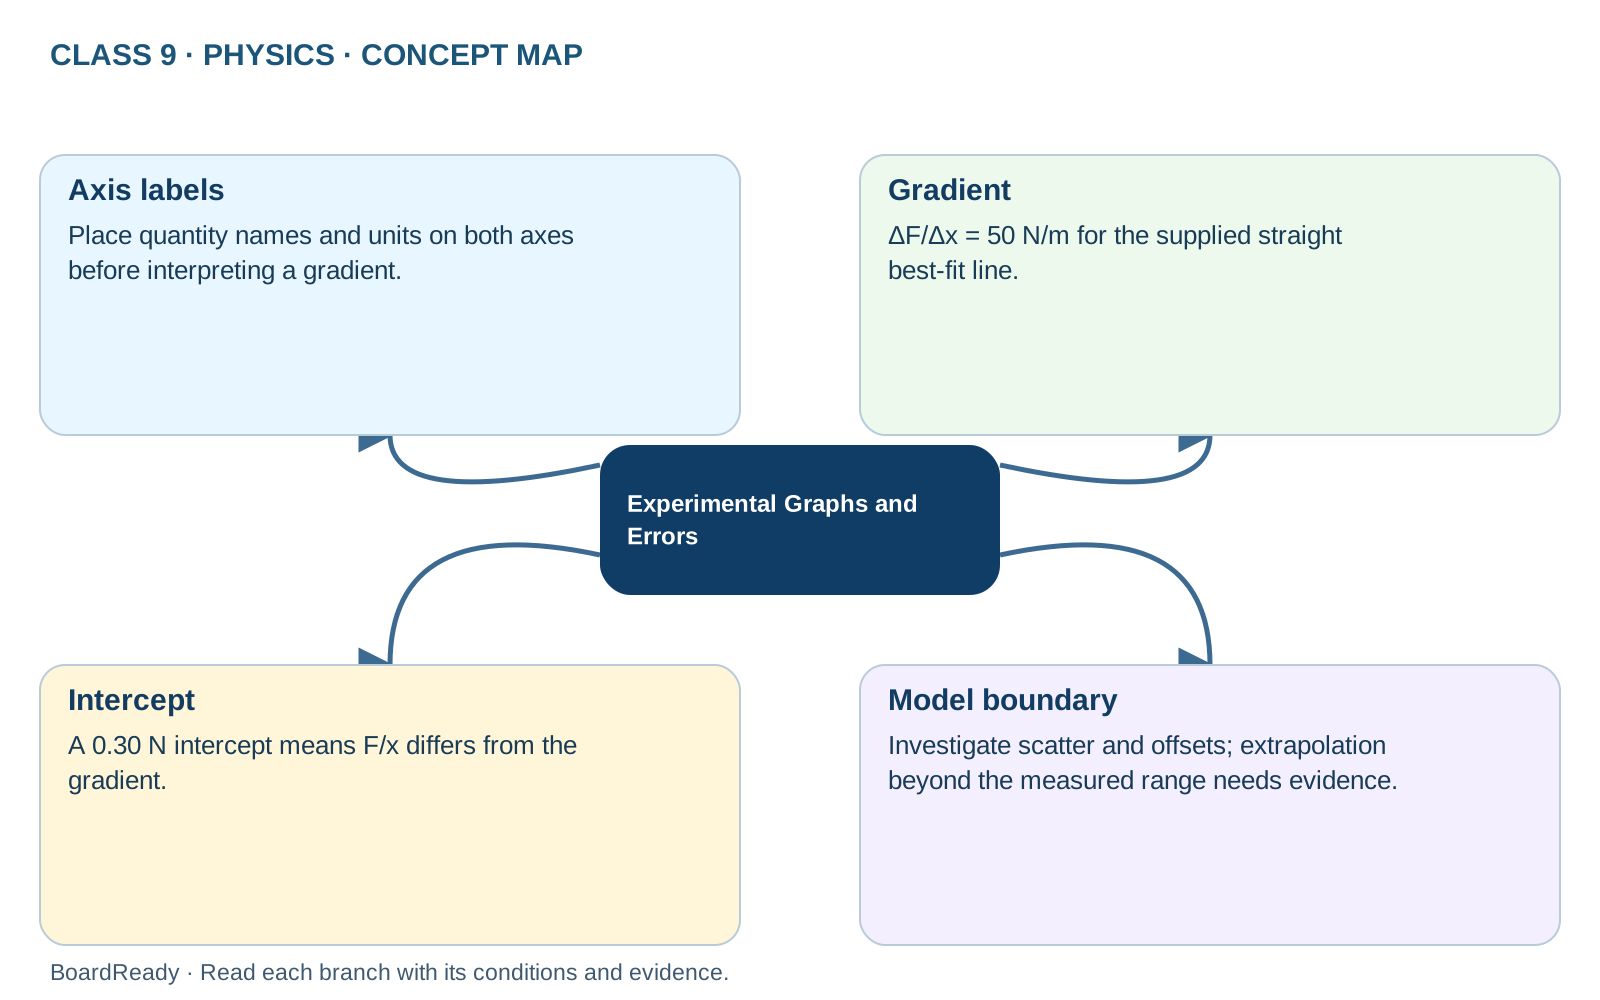
- 1Experimental Graphs and Errors -> Axis labels: Place quantity names and units on both axes before interpreting a gradient.
- 2Experimental Graphs and Errors -> Gradient: ΔF/Δx = 50 N/m for the supplied straight best-fit line.
- 3Experimental Graphs and Errors -> Intercept: A 0.30 N intercept means F/x differs from the gradient.
- 4Experimental Graphs and Errors -> Model boundary: Investigate scatter and offsets; extrapolation beyond the measured range needs evidence.