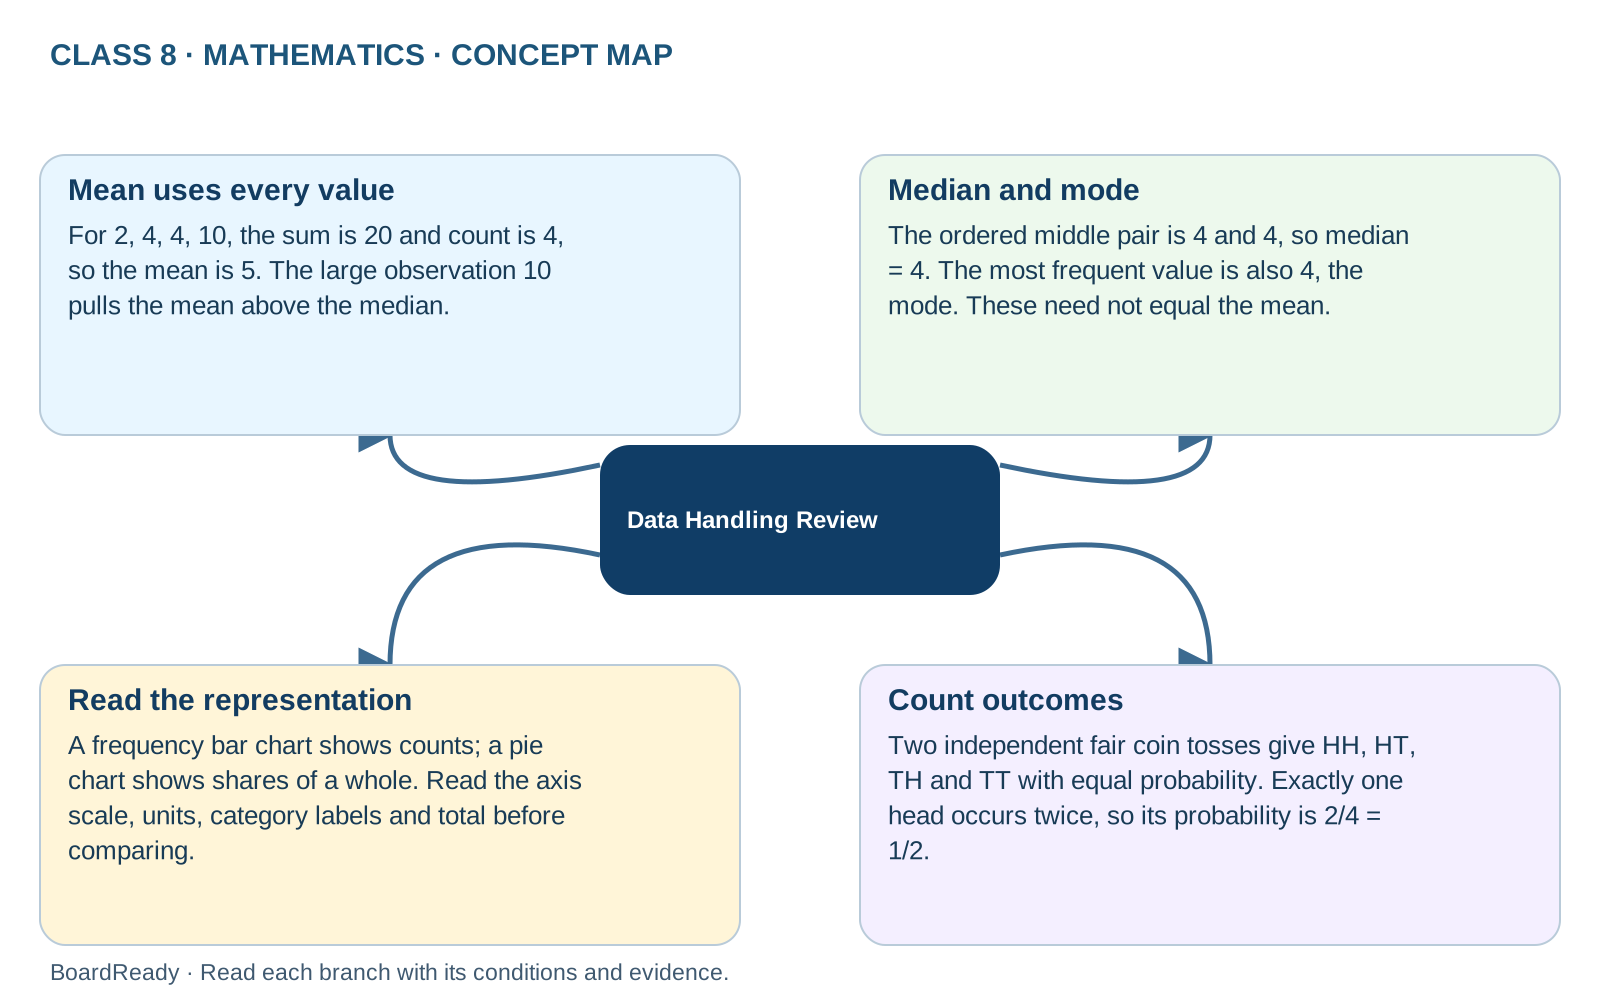
Comparison map
Data Handling Review: relationships and examples
Use the distribution of observations to explain different averages and count equally likely elementary outcomes for probability.Exam cue: Do not average category names or treat head-count categories as equally likely.
- 1Data Handling Review -> Mean uses every value: For 2, 4, 4, 10, the sum is 20 and count is 4, so the mean is 5. The large observation 10 pulls the mean above the median.
- 2Data Handling Review -> Median and mode: The ordered middle pair is 4 and 4, so median = 4. The most frequent value is also 4, the mode. These need not equal the mean.
- 3Data Handling Review -> Read the representation: A frequency bar chart shows counts; a pie chart shows shares of a whole. Read the axis scale, units, category labels and total before comparing.
- 4Data Handling Review -> Count outcomes: Two independent fair coin tosses give HH, HT, TH and TT with equal probability. Exactly one head occurs twice, so its probability is 2/4 = 1/2.