Comparison map
Pictographs and Bar Graphs: relationships and examples
A chart's key and scale connect visual marks with numerical frequencies.Exam cue: A picture or bar without a stated key or scale is not enough to read an exact count.
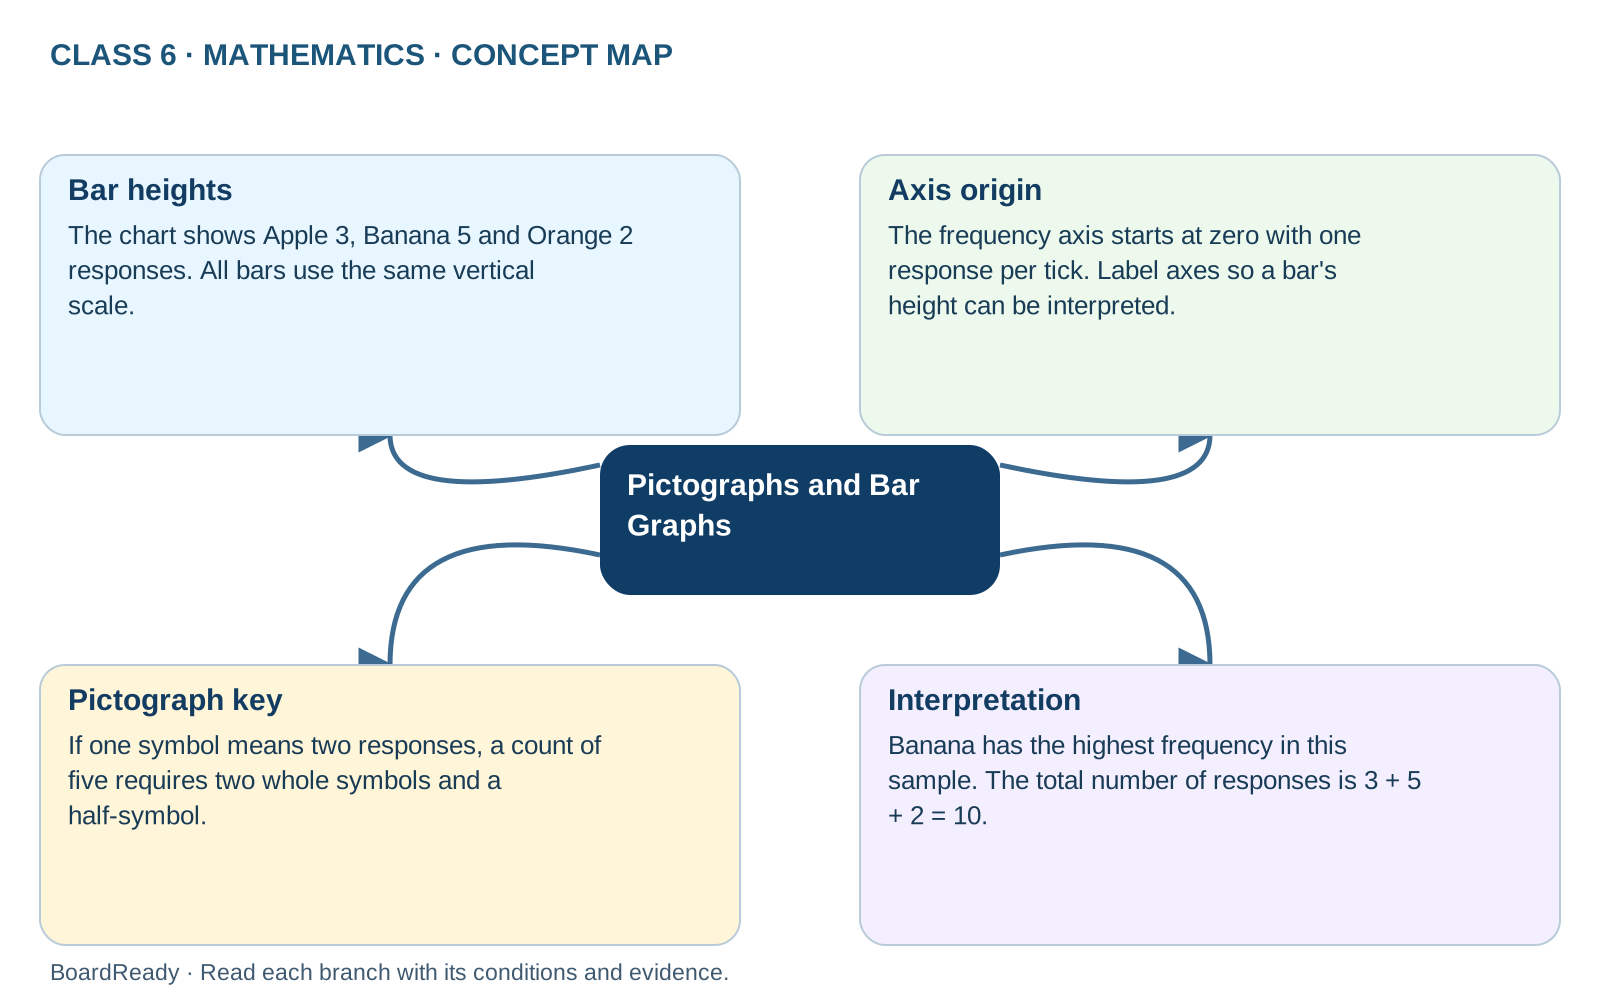
- 1Pictographs and Bar Graphs -> Bar heights: The chart shows Apple 3, Banana 5 and Orange 2 responses. All bars use the same vertical scale.
- 2Pictographs and Bar Graphs -> Axis origin: The frequency axis starts at zero with one response per tick. Label axes so a bar's height can be interpreted.
- 3Pictographs and Bar Graphs -> Pictograph key: If one symbol means two responses, a count of five requires two whole symbols and a half-symbol.
- 4Pictographs and Bar Graphs -> Interpretation: Banana has the highest frequency in this sample. The total number of responses is 3 + 5 + 2 = 10.