Comparison map
Data Handling Review: relationships and examples
Connect tables, picture keys and graph scales, then answer only what the recorded data can support. Table and pictograph agree: Collected bottles: Monday 14, Tuesday 20, Wednesday 18. With one symbol = 4 and half = 2, use 3.5, 5 and 4.5 symbol equivalents; the total is 52 bottles. Use the numbered scale: A 14-bottle bar spans 7 intervals of 2 or 3.5 intervals of 4. In the second graph, 14 lies halfway between 12 and 16. The underlying count is unchanged. Choose the required operation: For the complete three-day collection, add to get 52 bottles. For Tuesday compared with Monday, subtract 20 − 14 = 6 bottles. Do not add two graphs of the same data. Separate zero from missing: In a different week, counts 14, 20, unknown and 0 give a known subtotal of 34. The four-day total is unknown; hypothetical completions are not measurements.Exam cue: Read title, unit and period; apply key or scale; choose the operation; check totals and identify any missing information.
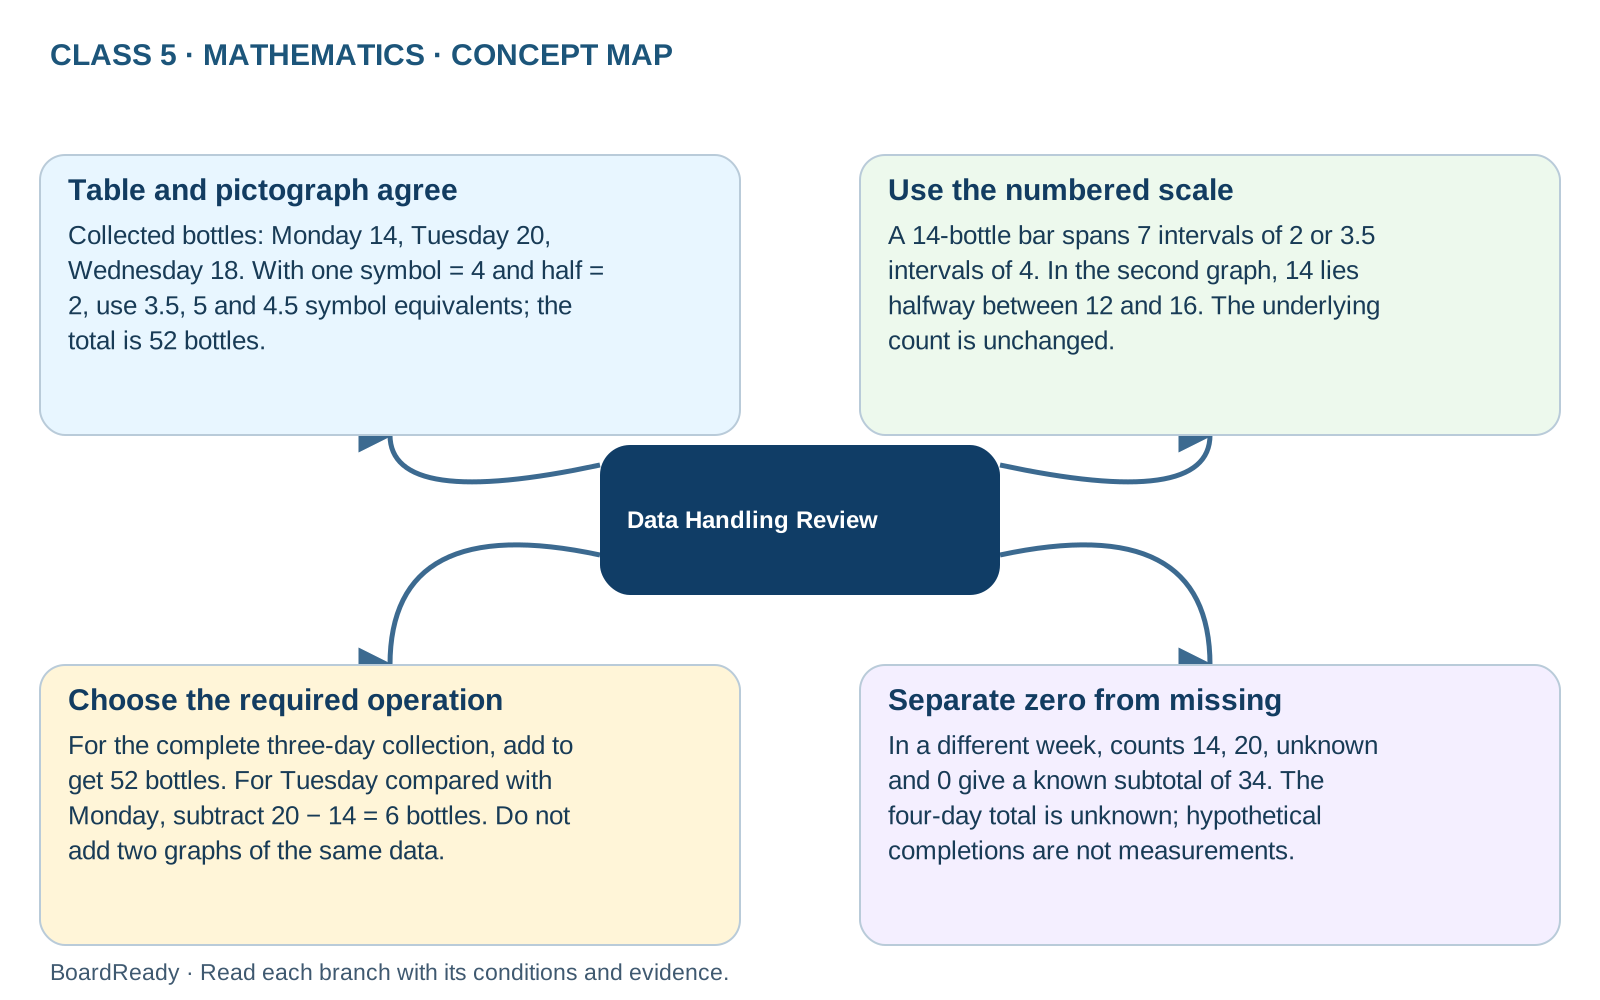
- 1Data Handling Review -> Table and pictograph agree: Collected bottles: Monday 14, Tuesday 20, Wednesday 18. With one symbol = 4 and half = 2, use 3.5, 5 and 4.5 symbol equivalents; the total is 52 bottles.
- 2Data Handling Review -> Use the numbered scale: A 14-bottle bar spans 7 intervals of 2 or 3.5 intervals of 4. In the second graph, 14 lies halfway between 12 and 16. The underlying count is unchanged.
- 3Data Handling Review -> Choose the required operation: For the complete three-day collection, add to get 52 bottles. For Tuesday compared with Monday, subtract 20 − 14 = 6 bottles. Do not add two graphs of the same data.
- 4Data Handling Review -> Separate zero from missing: In a different week, counts 14, 20, unknown and 0 give a known subtotal of 34. The four-day total is unknown; hypothetical completions are not measurements.