Comparison map
Measurement Errors and Significant Figures: relationships and examples
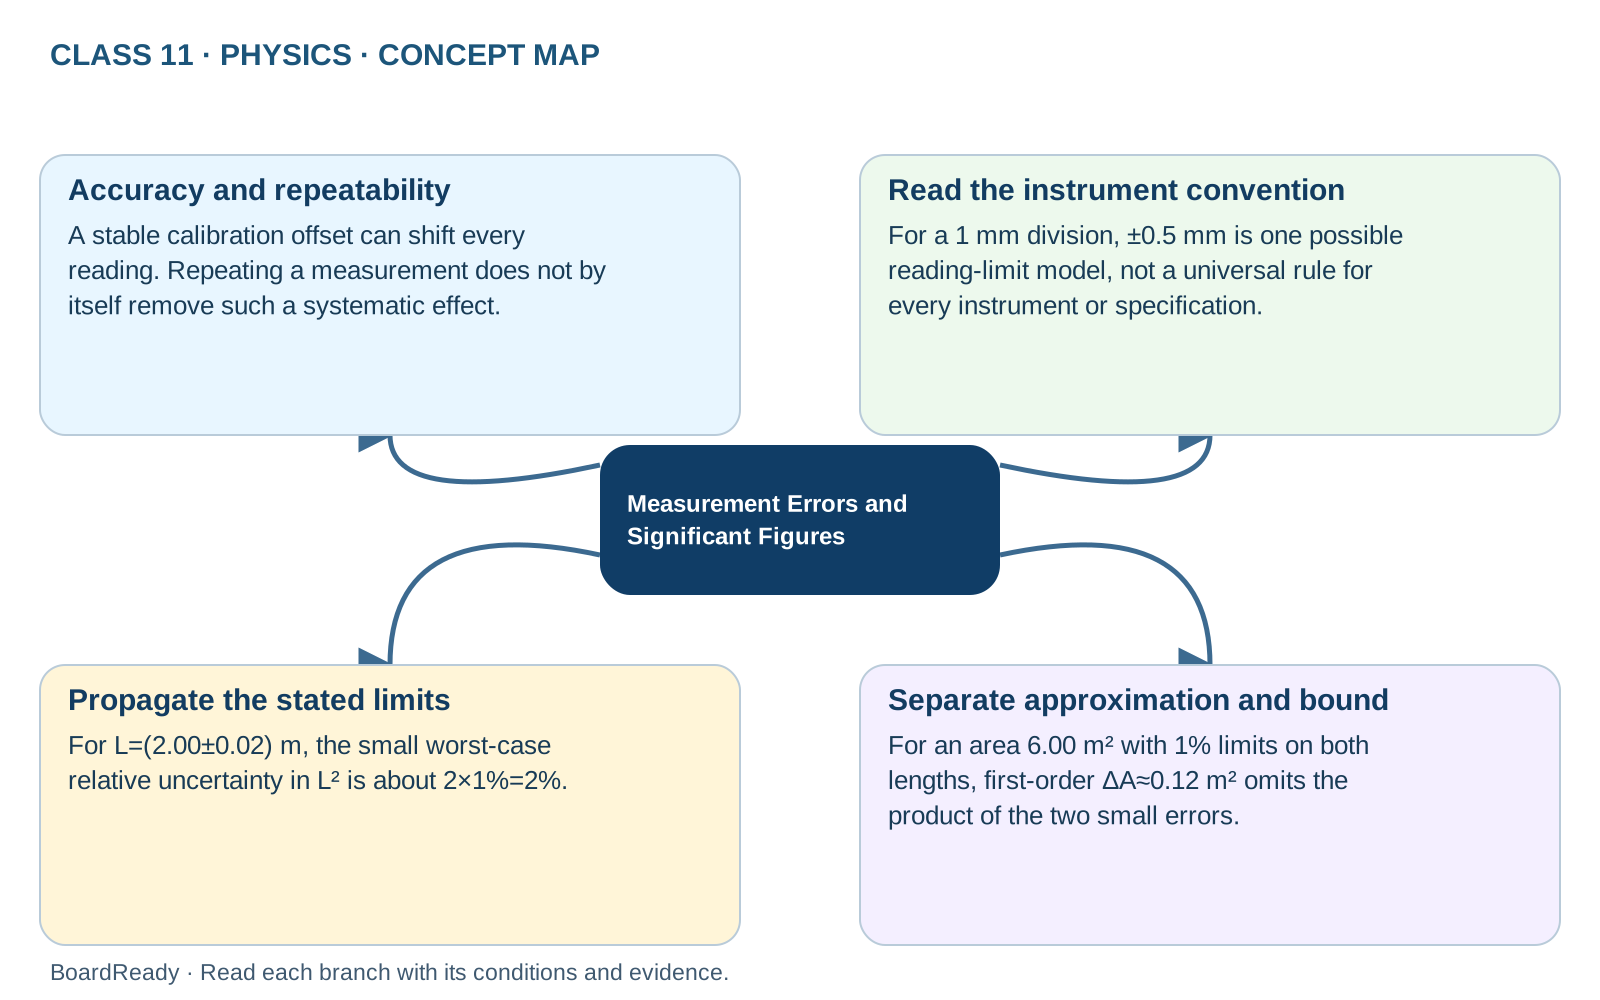
A useful measurement report includes a value, uncertainty and the method used to obtain them. Accuracy and repeatability: A stable calibration offset can shift every reading. Repeating a measurement does not by itself remove such a systematic effect. Read the instrument convention: For a 1 mm division, ±0.5 mm is one possible reading-limit model, not a universal rule for every instrument or specification. Propagate the stated limits: For L=(2.00±0.02) m, the small worst-case relative uncertainty in L² is about 2×1%=2%. Separate approximation and bound: For an area 6.00 m² with 1% limits on both lengths, first-order ΔA≈0.12 m² omits the product of the two small errors.Exam cue: Report the uncertainty model, retain units and avoid treating the last displayed digit as exact.
- 1Measurement Errors and Significant Figures -> Accuracy and repeatability: A stable calibration offset can shift every reading. Repeating a measurement does not by itself remove such a systematic effect.
- 2Measurement Errors and Significant Figures -> Read the instrument convention: For a 1 mm division, ±0.5 mm is one possible reading-limit model, not a universal rule for every instrument or specification.
- 3Measurement Errors and Significant Figures -> Propagate the stated limits: For L=(2.00±0.02) m, the small worst-case relative uncertainty in L² is about 2×1%=2%.
- 4Measurement Errors and Significant Figures -> Separate approximation and bound: For an area 6.00 m² with 1% limits on both lengths, first-order ΔA≈0.12 m² omits the product of the two small errors.