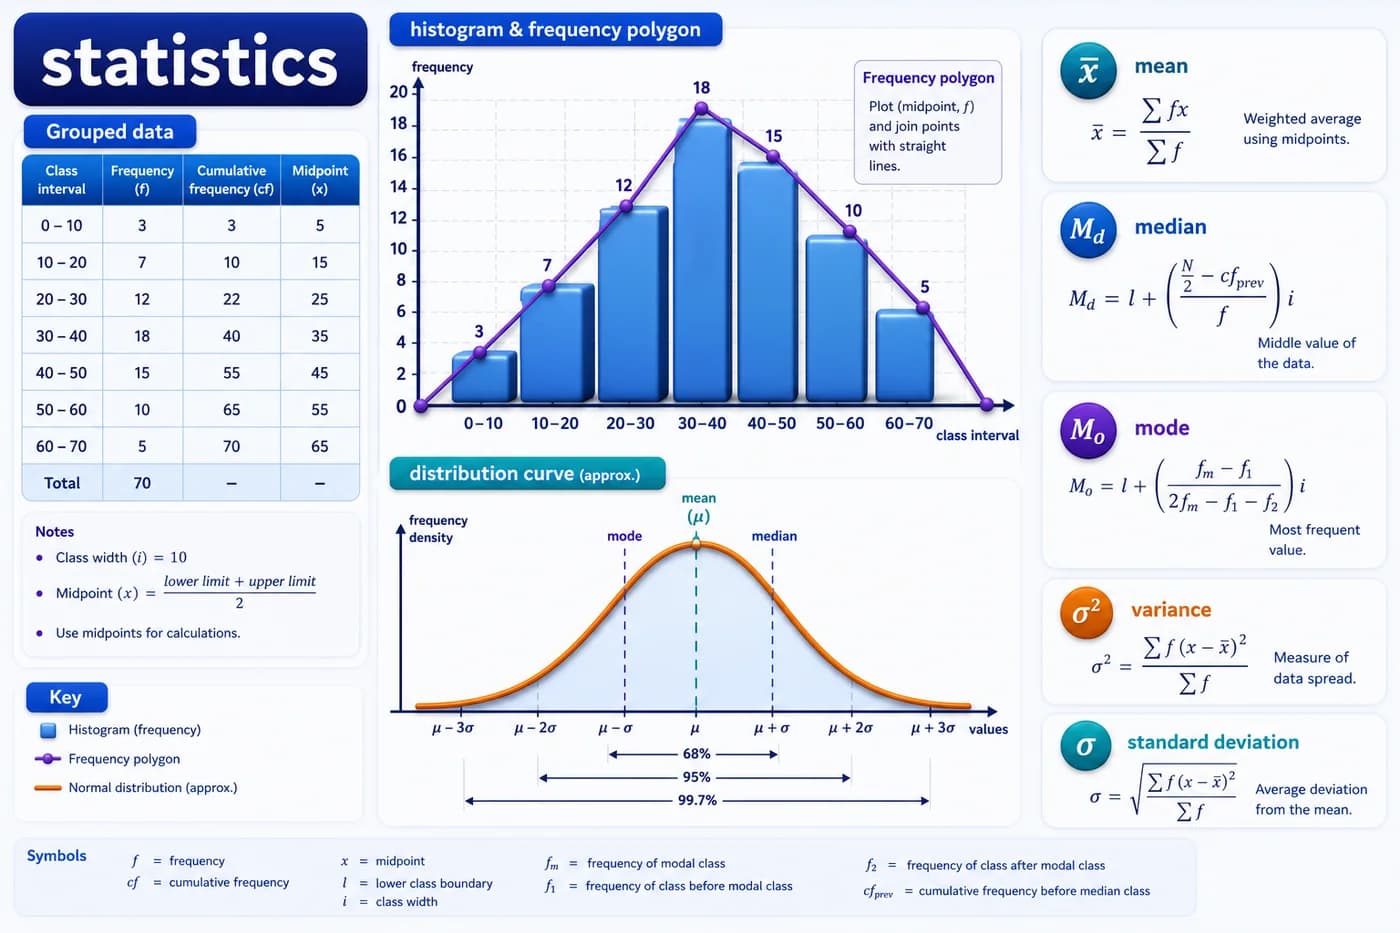
Statistics concept map
Use this compact map to see what drives a question on Statistics.Exam cue: The cleanest math answers make the method visible before the final line.
- 1Given -> Method: choose
- 2Method -> Working: apply
- 3Working -> Result: state
Checking progress account…
Opening your study space…
Lesson
Calculate range, mean deviation, variance, and standard deviation for grouped and ungrouped data.
Learning objectives
Explain Statistics using the correct Grade 11 Mathematics terms.
Connect the question type to the correct method, rule, theorem, graph idea, or operation.
Use one clear working path and write the final answer in the required form.
Lesson
Ready to check what you remember?
Continue to revisionStudy path
Notes
Review the compact notes before moving into recall.
Open notesShowing 4 of 5 notes.
Diagrams
Practice
Choose one small set. The full bank opens only inside the practice session.
In this chapter
Now on Statistics. Next up: Probability.
Lesson progress
Save this lesson when done. Next: Probability.
Keep moving