
Comparison map
Data Collection and Organisation: relationships and examples
Create clear categories and frequencies while checking what the data can support.Exam cue: Preserve the meaning and collection conditions when summarising data.
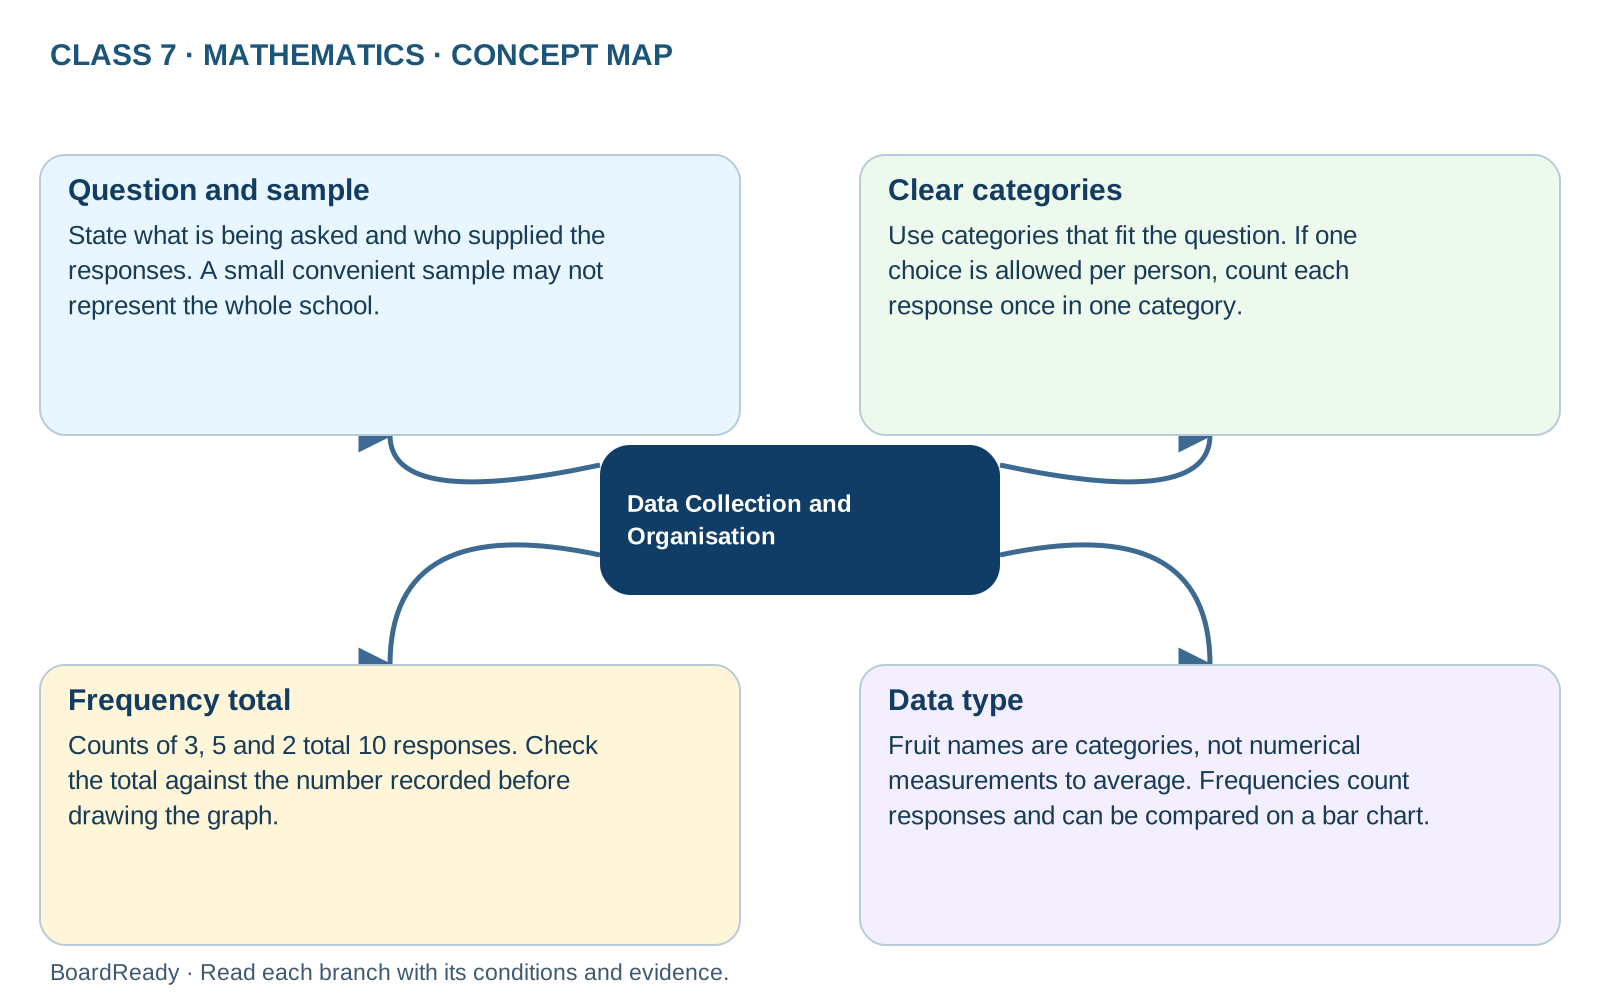
- 1Data Collection and Organisation -> Question and sample: State what is being asked and who supplied the responses. A small convenient sample may not represent the whole school.
- 2Data Collection and Organisation -> Clear categories: Use categories that fit the question. If one choice is allowed per person, count each response once in one category.
- 3Data Collection and Organisation -> Frequency total: Counts of 3, 5 and 2 total 10 responses. Check the total against the number recorded before drawing the graph.
- 4Data Collection and Organisation -> Data type: Fruit names are categories, not numerical measurements to average. Frequencies count responses and can be compared on a bar chart.