
Comparison map
Statistics: relationships and examples
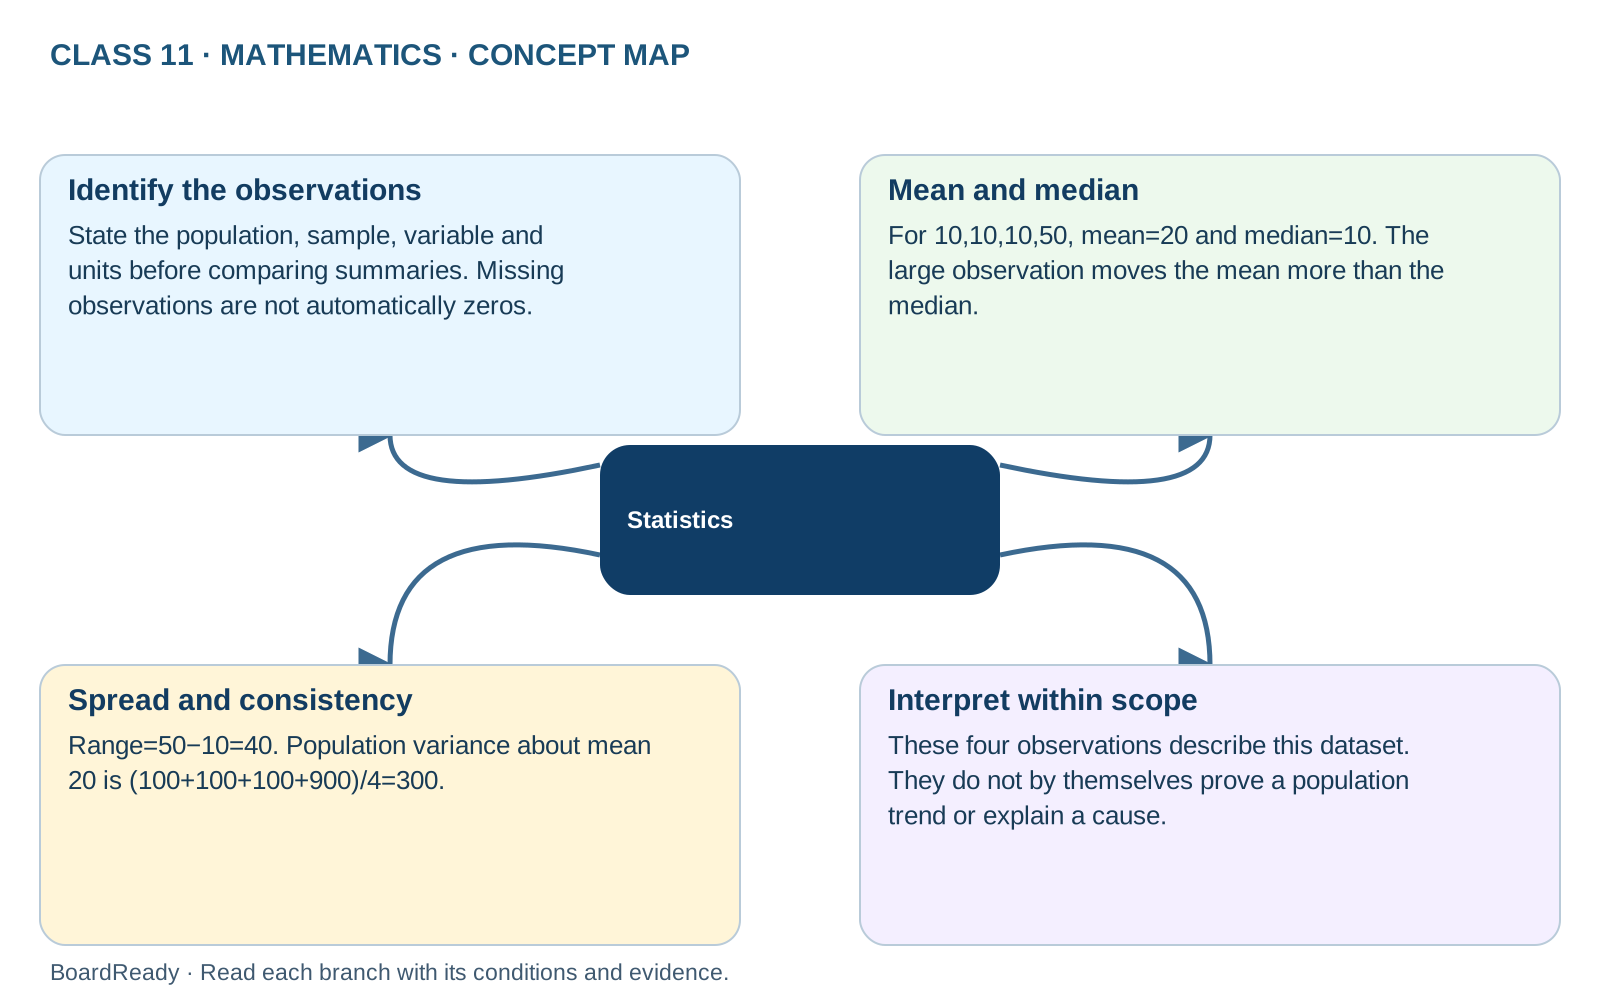
A useful summary identifies what was measured, its units and the effect of unusual values. Identify the observations: State the population, sample, variable and units before comparing summaries. Missing observations are not automatically zeros. Mean and median: For 10,10,10,50, mean=20 and median=10. The large observation moves the mean more than the median. Spread and consistency: Range=50−10=40. Population variance about mean 20 is (100+100+100+900)/4=300. Interpret within scope: These four observations describe this dataset. They do not by themselves prove a population trend or explain a cause.Exam cue: Report centre and spread together, with units and the measurement or sampling context.
- 1Statistics -> Identify the observations: State the population, sample, variable and units before comparing summaries. Missing observations are not automatically zeros.
- 2Statistics -> Mean and median: For 10,10,10,50, mean=20 and median=10. The large observation moves the mean more than the median.
- 3Statistics -> Spread and consistency: Range=50−10=40. Population variance about mean 20 is (100+100+100+900)/4=300.
- 4Statistics -> Interpret within scope: These four observations describe this dataset. They do not by themselves prove a population trend or explain a cause.