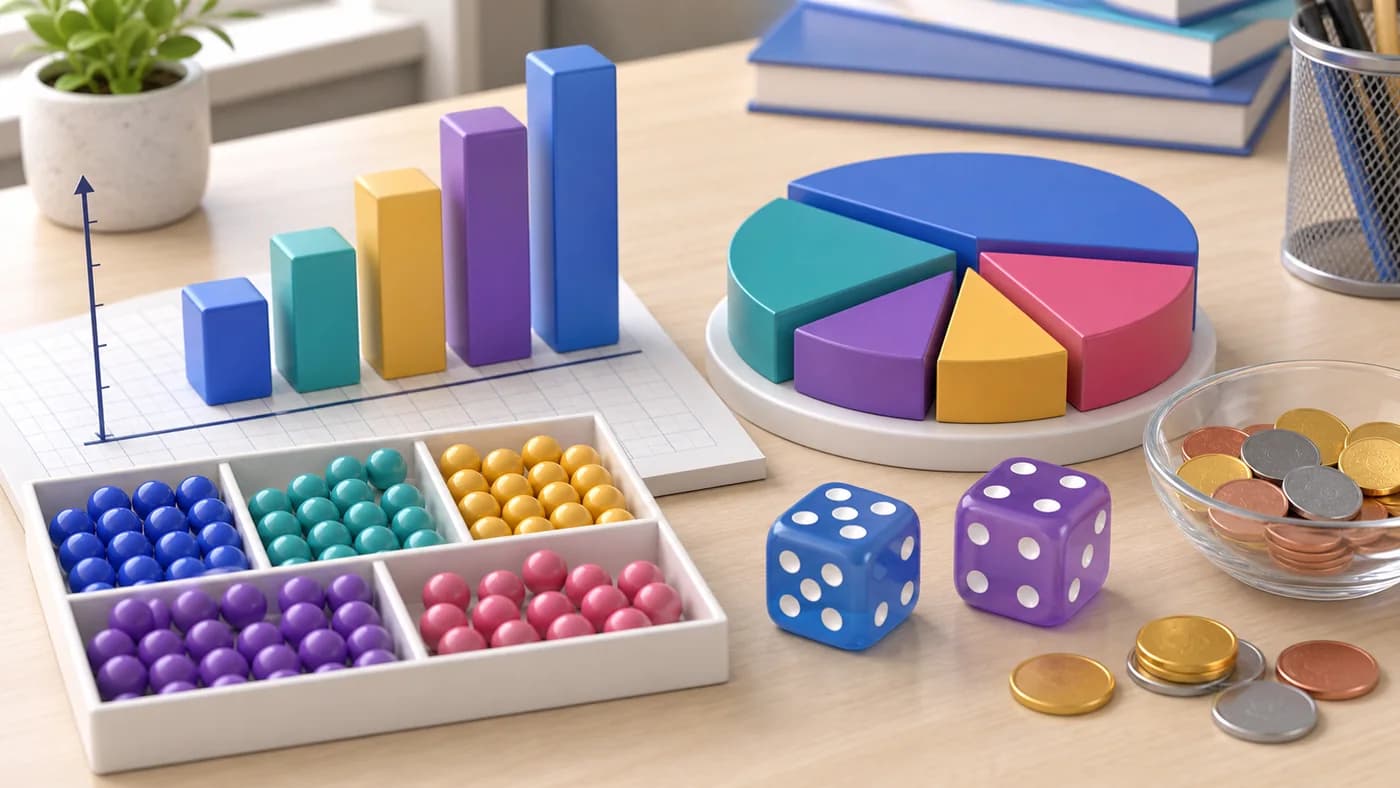
Data to chance model
Use this structure to explain data to chance without skipping the key mathematical relationship.- 1Data set -> Average: summarised by
- 2Outcomes -> Probability: used for
Checking progress account…
Opening your study space…
Lesson
Statistics organises and interprets data, while probability measures the chance of an event based on outcomes or observed frequencies.
Learning objectives
Explain Statistics and Probability Basics with the correct Grade 9 Mathematics method.
Show the key step clearly instead of skipping from setup to answer.
Check the final form, sign, unit, or graph reading before finishing.
Lesson
Ready to check what you remember?
Continue to revisionStudy path
Notes
Review the compact notes before moving into recall.
Open notesShowing 4 of 5 notes.
Diagrams

Practice
Choose one small set. The full bank opens only inside the practice session.
In this chapter
Now on Statistics and Probability Basics.
Lesson progress
Save this lesson when done.
Keep moving