Comparison map
Graphs of Linear Equations: relationships and examples
A straight-line graph represents all ordered pairs satisfying its equation, including points between plotted samples.Exam cue: State the axis scales and verify intersection coordinates by substitution.
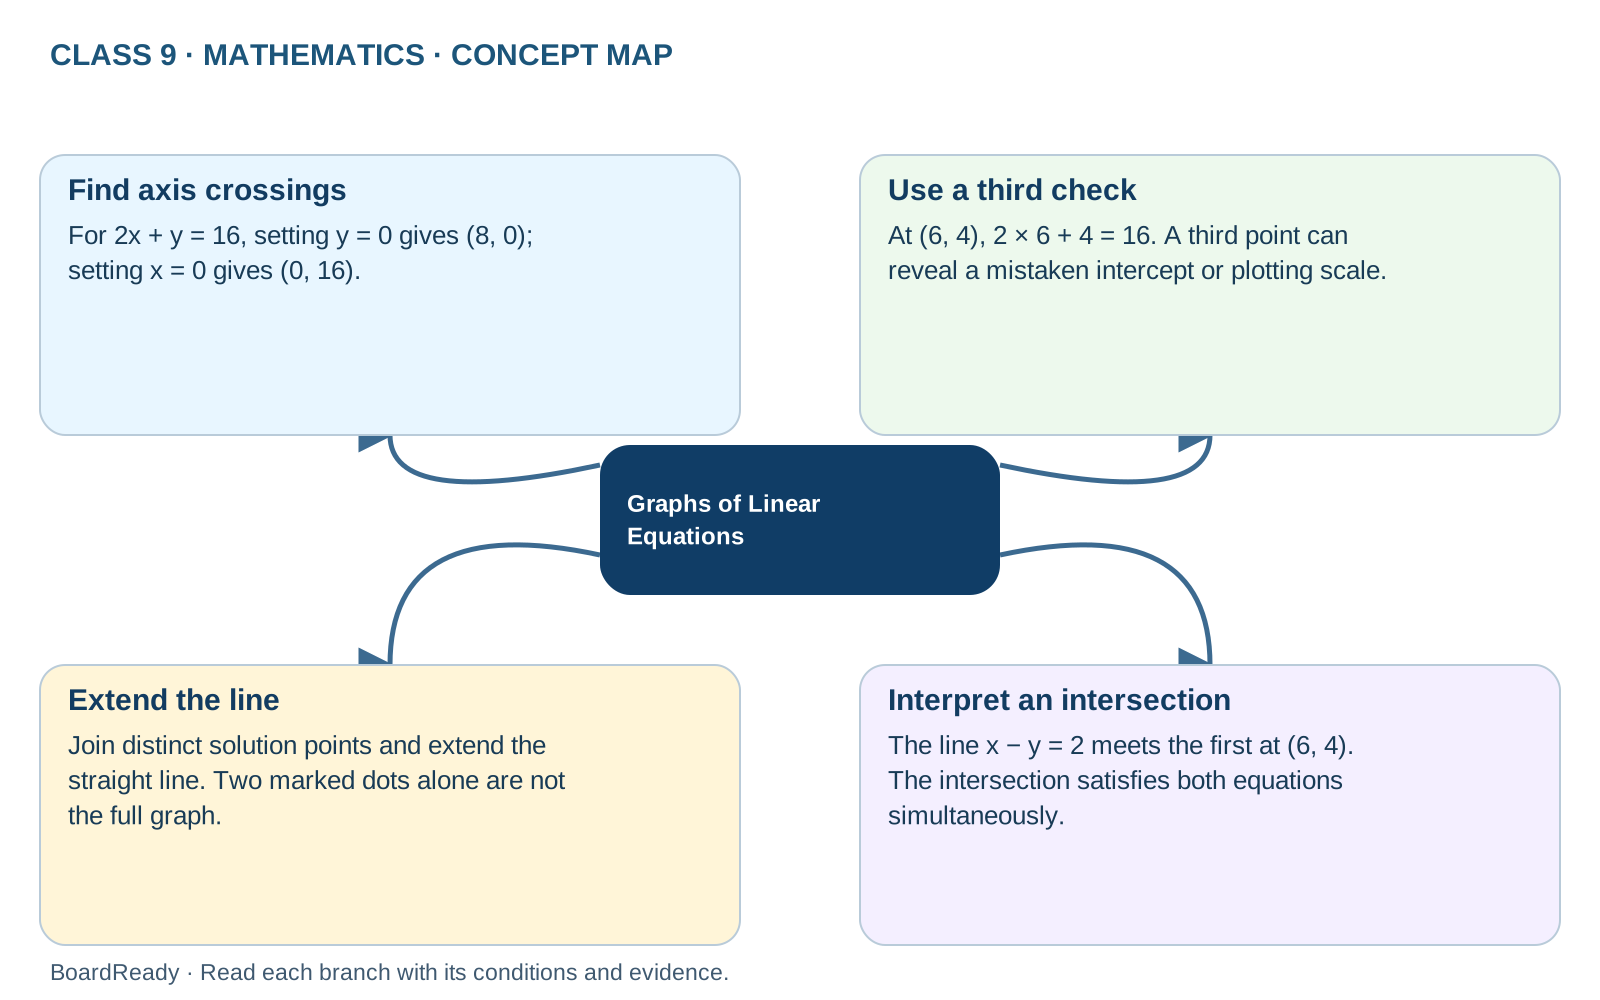
- 1Graphs of Linear Equations -> Find axis crossings: For 2x + y = 16, setting y = 0 gives (8, 0); setting x = 0 gives (0, 16).
- 2Graphs of Linear Equations -> Use a third check: At (6, 4), 2 × 6 + 4 = 16. A third point can reveal a mistaken intercept or plotting scale.
- 3Graphs of Linear Equations -> Extend the line: Join distinct solution points and extend the straight line. Two marked dots alone are not the full graph.
- 4Graphs of Linear Equations -> Interpret an intersection: The line x − y = 2 meets the first at (6, 4). The intersection satisfies both equations simultaneously.