Comparison map
Simple Graphs and Experiments: relationships and examples
Read the interval slope and control the variables behind the graph.Exam cue: Use two points on the interpreted segment rather than dividing its final coordinates.
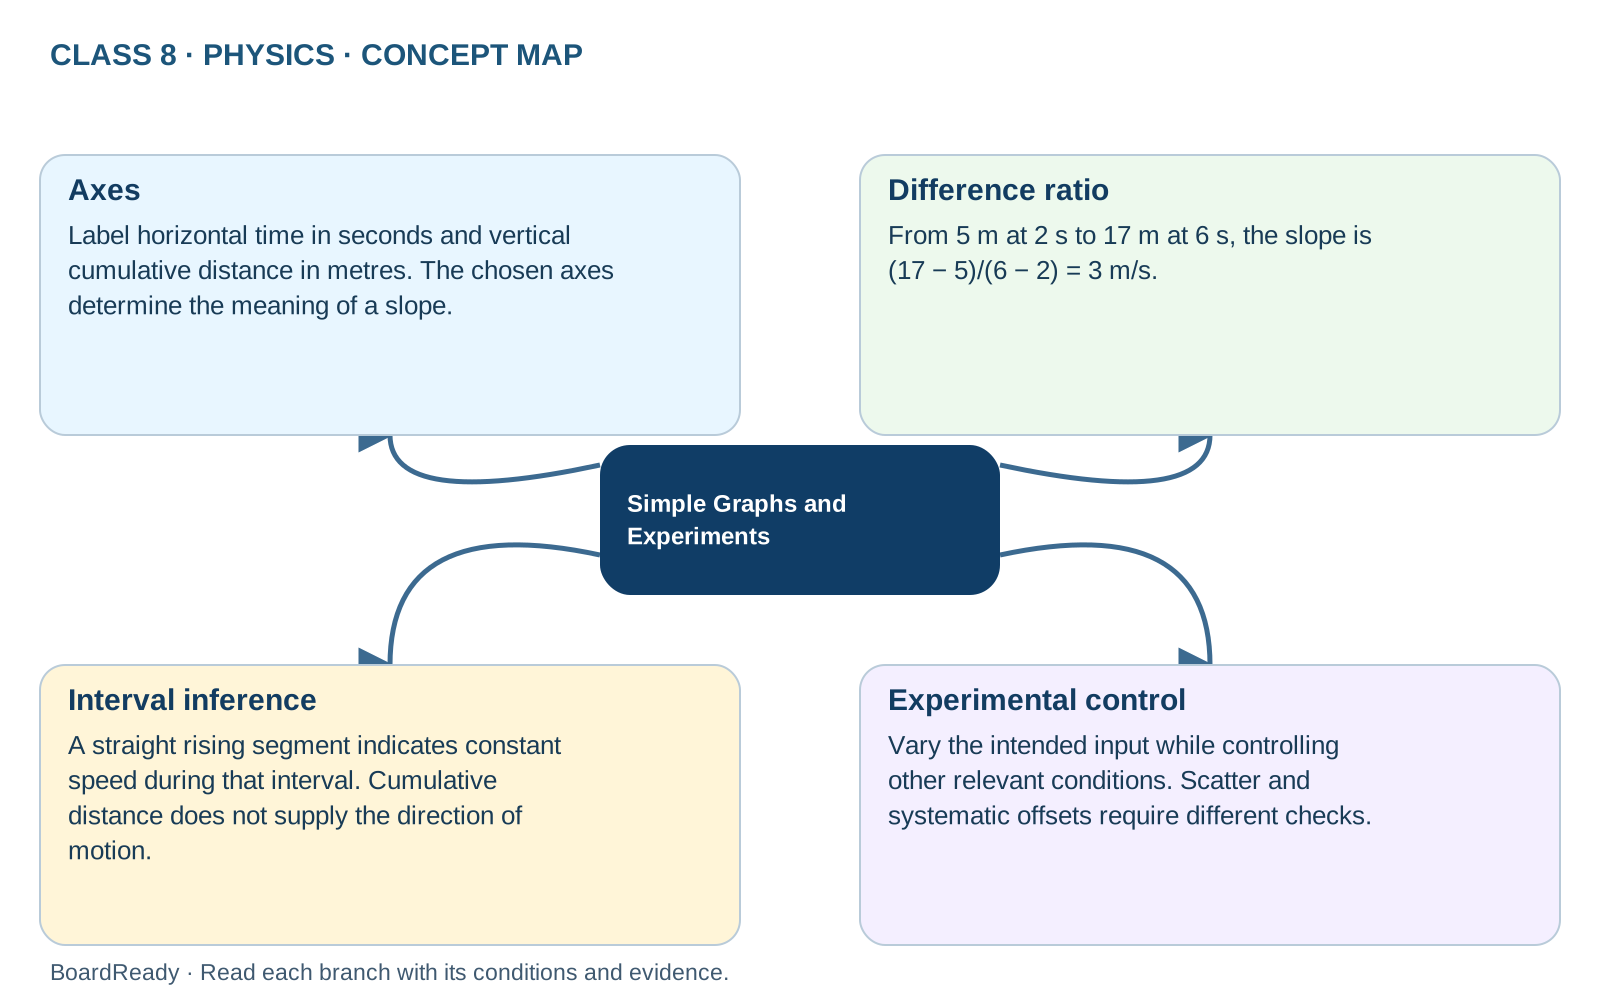
- 1Simple Graphs and Experiments -> Axes: Label horizontal time in seconds and vertical cumulative distance in metres. The chosen axes determine the meaning of a slope.
- 2Simple Graphs and Experiments -> Difference ratio: From 5 m at 2 s to 17 m at 6 s, the slope is (17 − 5)/(6 − 2) = 3 m/s.
- 3Simple Graphs and Experiments -> Interval inference: A straight rising segment indicates constant speed during that interval. Cumulative distance does not supply the direction of motion.
- 4Simple Graphs and Experiments -> Experimental control: Vary the intended input while controlling other relevant conditions. Scatter and systematic offsets require different checks.