Comparison map
Data Handling Review: relationships and examples
Connect data collection, graph scales, numerical summaries and probability assumptions.Exam cue: Do not confuse measured numerical values, category labels and counts of responses.
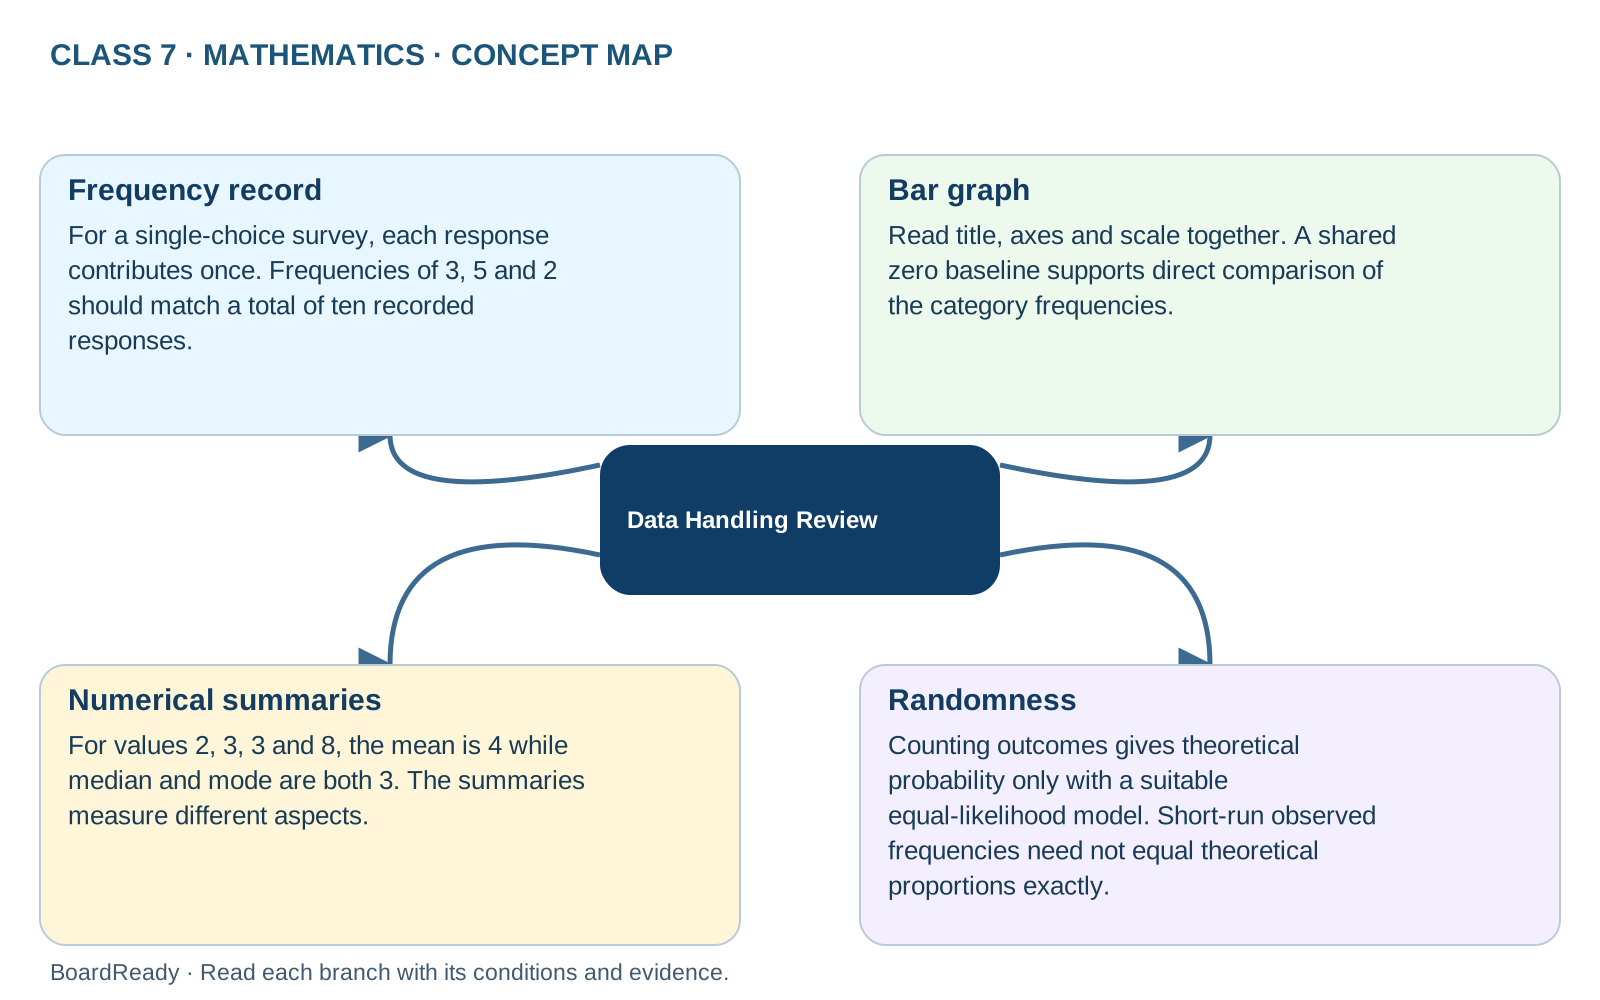
- 1Data Handling Review -> Frequency record: For a single-choice survey, each response contributes once. Frequencies of 3, 5 and 2 should match a total of ten recorded responses.
- 2Data Handling Review -> Bar graph: Read title, axes and scale together. A shared zero baseline supports direct comparison of the category frequencies.
- 3Data Handling Review -> Numerical summaries: For values 2, 3, 3 and 8, the mean is 4 while median and mode are both 3. The summaries measure different aspects.
- 4Data Handling Review -> Randomness: Counting outcomes gives theoretical probability only with a suitable equal-likelihood model. Short-run observed frequencies need not equal theoretical proportions exactly.