Comparison map
Data Handling Review: relationships and examples
Use frequencies to describe categories and numerical summaries to describe measured values.Exam cue: Do not calculate a mean of category names such as fruit types.
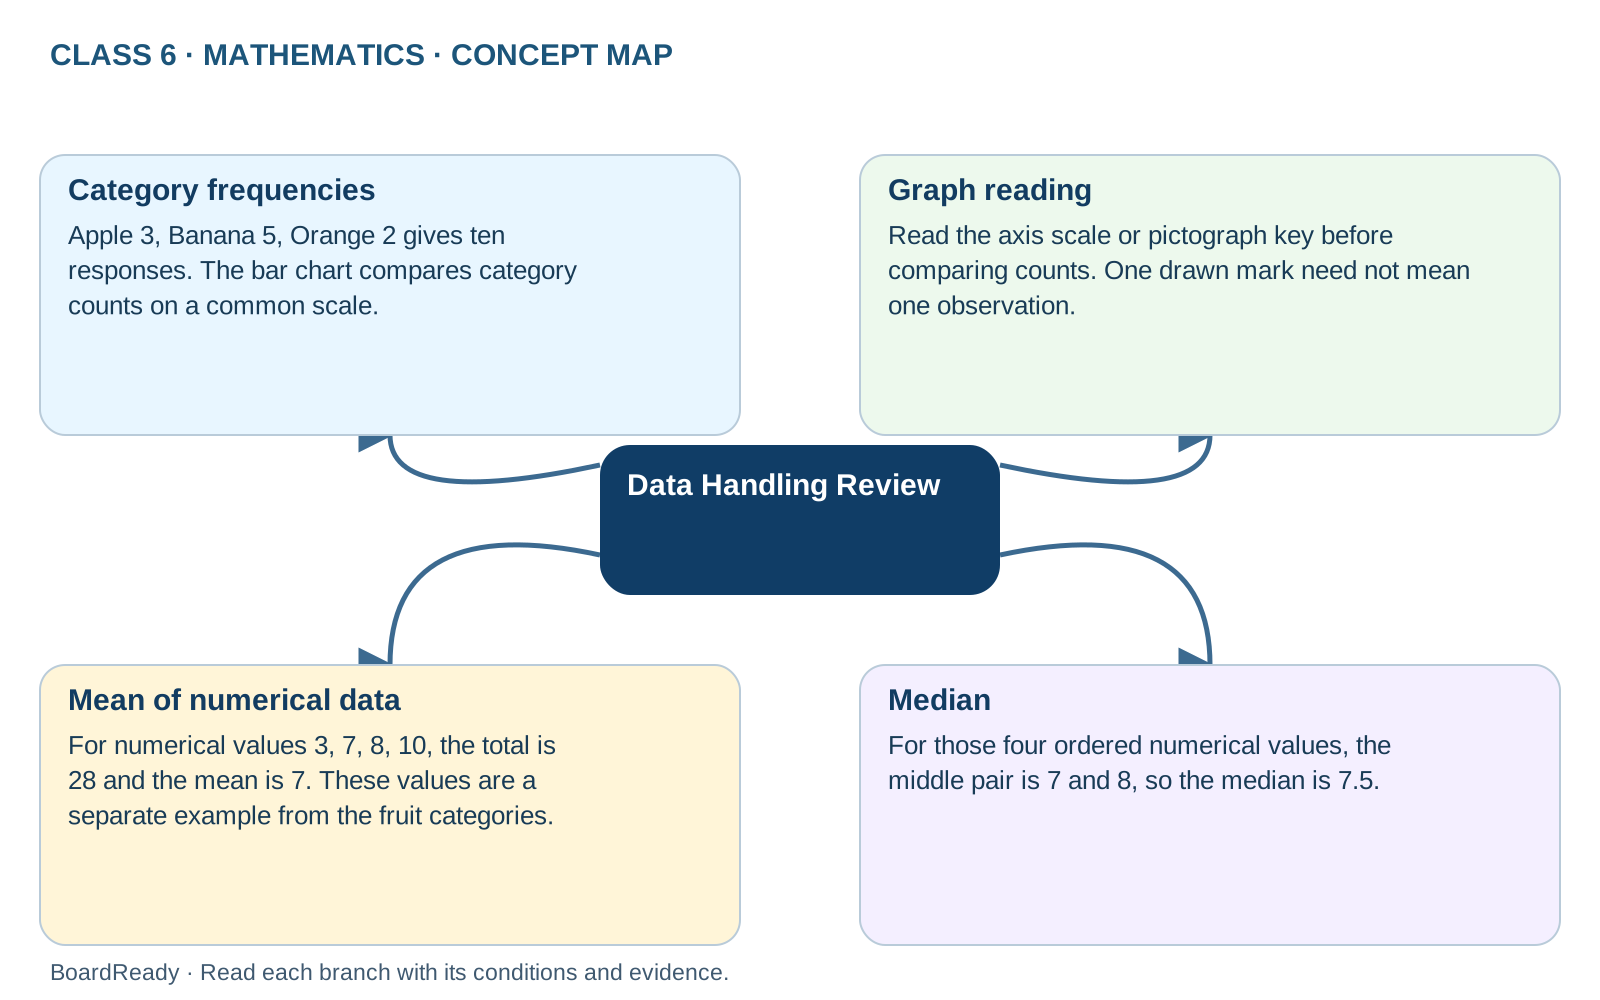
- 1Data Handling Review -> Category frequencies: Apple 3, Banana 5, Orange 2 gives ten responses. The bar chart compares category counts on a common scale.
- 2Data Handling Review -> Graph reading: Read the axis scale or pictograph key before comparing counts. One drawn mark need not mean one observation.
- 3Data Handling Review -> Mean of numerical data: For numerical values 3, 7, 8, 10, the total is 28 and the mean is 7. These values are a separate example from the fruit categories.
- 4Data Handling Review -> Median: For those four ordered numerical values, the middle pair is 7 and 8, so the median is 7.5.