Comparison map
Evolution: relationships and examples
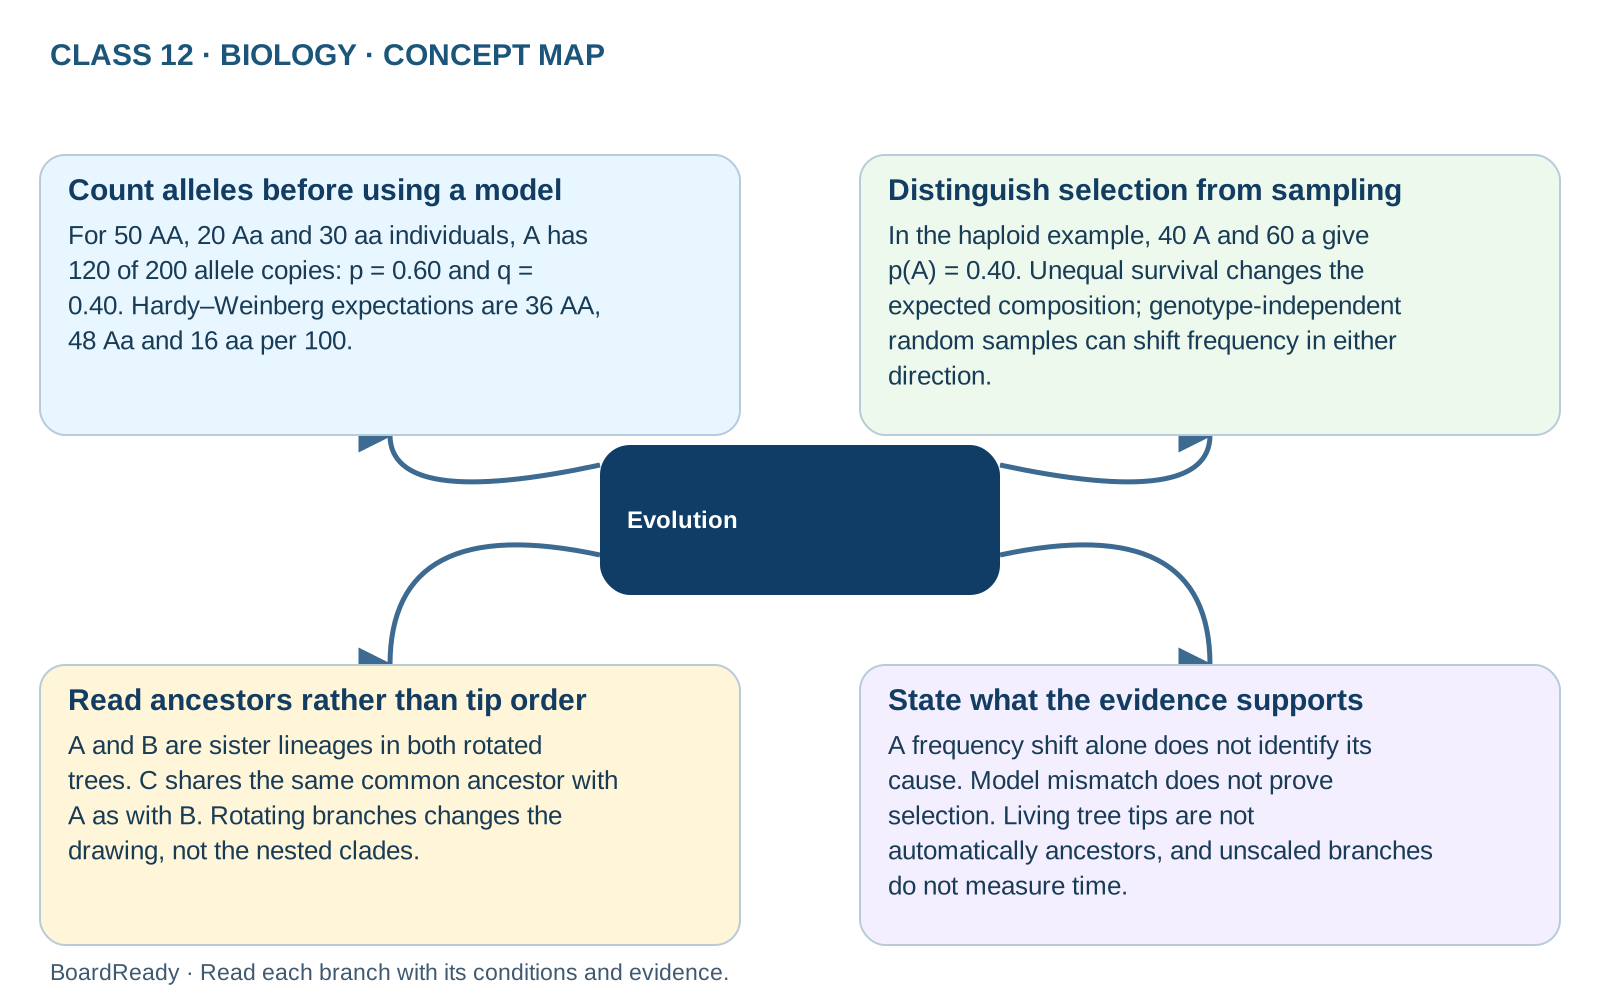
Connect allele counting, model expectations, evolutionary mechanisms and branching relationships without confusing their evidence. Count alleles before using a model: For 50 AA, 20 Aa and 30 aa individuals, A has 120 of 200 allele copies: p = 0.60 and q = 0.40. Hardy–Weinberg expectations are 36 AA, 48 Aa and 16 aa per 100. Distinguish selection from sampling: In the haploid example, 40 A and 60 a give p(A) = 0.40. Unequal survival changes the expected composition; genotype-independent random samples can shift frequency in either direction. Read ancestors rather than tip order: A and B are sister lineages in both rotated trees. C shares the same common ancestor with A as with B. Rotating branches changes the drawing, not the nested clades. State what the evidence supports: A frequency shift alone does not identify its cause. Model mismatch does not prove selection. Living tree tips are not automatically ancestors, and unscaled branches do not measure time.Exam cue: Keep observations, calculations and assumptions separate. Count both allele copies in diploids, identify the mechanism before naming selection or drift, and compare most recent common ancestors rather than neighbouring tip labels.
- 1Evolution -> Count alleles before using a model: For 50 AA, 20 Aa and 30 aa individuals, A has 120 of 200 allele copies: p = 0.60 and q = 0.40. Hardy–Weinberg expectations are 36 AA, 48 Aa and 16 aa per 100.
- 2Evolution -> Distinguish selection from sampling: In the haploid example, 40 A and 60 a give p(A) = 0.40. Unequal survival changes the expected composition; genotype-independent random samples can shift frequency in either direction.
- 3Evolution -> Read ancestors rather than tip order: A and B are sister lineages in both rotated trees. C shares the same common ancestor with A as with B. Rotating branches changes the drawing, not the nested clades.
- 4Evolution -> State what the evidence supports: A frequency shift alone does not identify its cause. Model mismatch does not prove selection. Living tree tips are not automatically ancestors, and unscaled branches do not measure time.