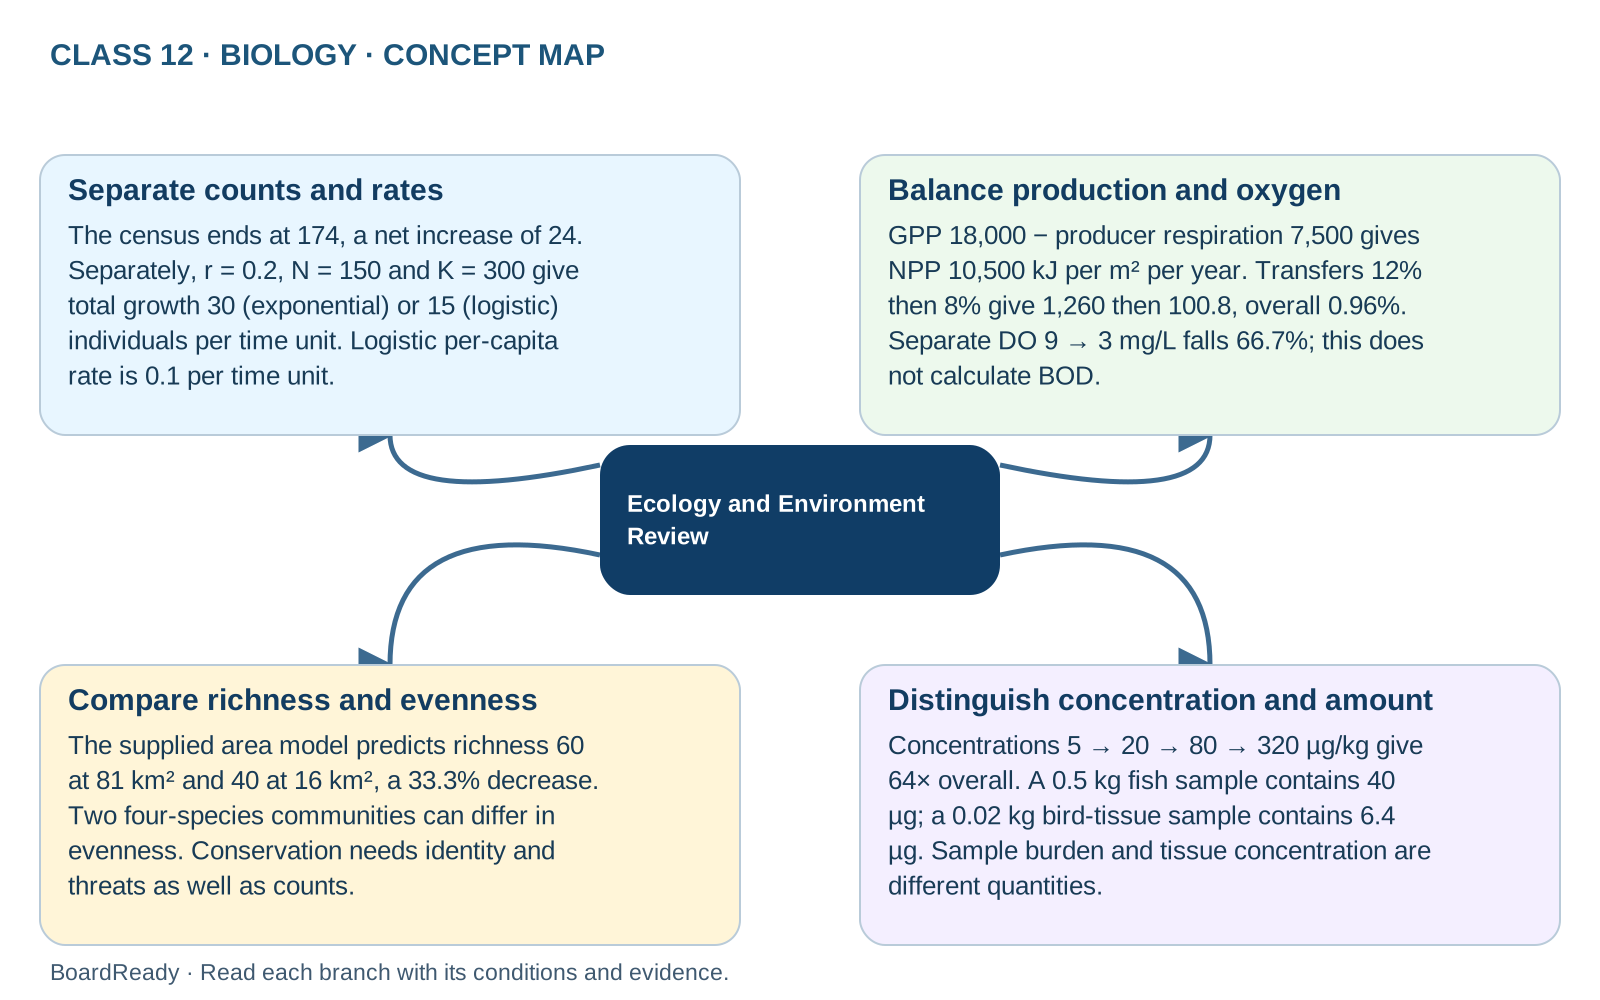
Comparison map
Ecology and Environment Review: relationships and examples
Connect population counts, ecosystem rates, biodiversity comparisons and environmental evidence without mixing their units or conclusions. Separate counts and rates: The census ends at 174, a net increase of 24. Separately, r = 0.2, N = 150 and K = 300 give total growth 30 (exponential) or 15 (logistic) individuals per time unit. Logistic per-capita rate is 0.1 per time unit. Balance production and oxygen: GPP 18,000 − producer respiration 7,500 gives NPP 10,500 kJ per m² per year. Transfers 12% then 8% give 1,260 then 100.8, overall 0.96%. Separate DO 9 → 3 mg/L falls 66.7%; this does not calculate BOD. Compare richness and evenness: The supplied area model predicts richness 60 at 81 km² and 40 at 16 km², a 33.3% decrease. Two four-species communities can differ in evenness. Conservation needs identity and threats as well as counts. Distinguish concentration and amount: Concentrations 5 → 20 → 80 → 320 µg/kg give 64× overall. A 0.5 kg fish sample contains 40 µg; a 0.02 kg bird-tissue sample contains 6.4 µg. Sample burden and tissue concentration are different quantities.Exam cue: Review scenarios use new supplied values; lesson diagrams retain their examples. State the ecological level, reference, unit and time basis, calculate, then limit the conclusion to the model or measured evidence.
- 1Ecology and Environment Review -> Separate counts and rates: The census ends at 174, a net increase of 24. Separately, r = 0.2, N = 150 and K = 300 give total growth 30 (exponential) or 15 (logistic) individuals per time unit. Logistic per-capita rate is 0.1 per time unit.
- 2Ecology and Environment Review -> Balance production and oxygen: GPP 18,000 − producer respiration 7,500 gives NPP 10,500 kJ per m² per year. Transfers 12% then 8% give 1,260 then 100.8, overall 0.96%. Separate DO 9 → 3 mg/L falls 66.7%; this does not calculate BOD.
- 3Ecology and Environment Review -> Compare richness and evenness: The supplied area model predicts richness 60 at 81 km² and 40 at 16 km², a 33.3% decrease. Two four-species communities can differ in evenness. Conservation needs identity and threats as well as counts.
- 4Ecology and Environment Review -> Distinguish concentration and amount: Concentrations 5 → 20 → 80 → 320 µg/kg give 64× overall. A 0.5 kg fish sample contains 40 µg; a 0.02 kg bird-tissue sample contains 6.4 µg. Sample burden and tissue concentration are different quantities.