Checking progress account…
Opening your study space…
Checking progress account…
Opening your study space…
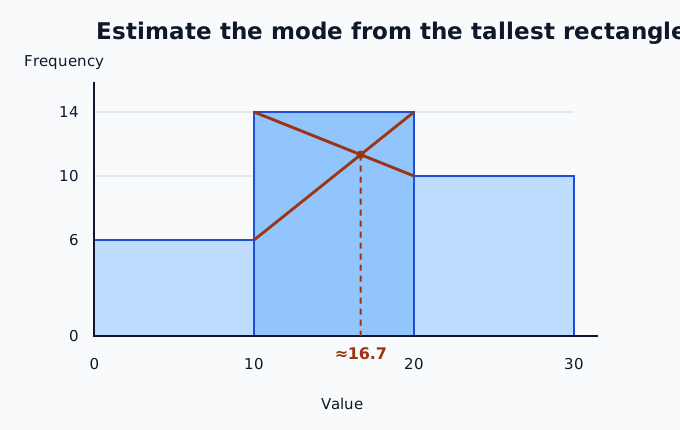
A histogram groups numerical values into continuous intervals. Use actual boundaries on the horizontal axis. Rectangles for adjacent occupied intervals share an edge. If there is an empty class, show its width with no rectangle.
Learning goals
Visual learning
Lesson
Read the full lesson below, or jump to the section you need.
Method
Ready to check what you remember?
Continue to revisionRevise
Practise
Start with a short MCQ set, write an answer, or combine both in a lesson test.
15 MCQs · 15 written questions. Each session opens a focused selection.
Lesson 1 of 2 · Graphical Representation
Lesson progress
Save this lesson when done. Next: Less-Than Ogives, Median, and Quartiles.
Lesson navigation