Comparison map
Statistics Review: relationships and examples
Frequency weights, ordered positions and class grouping answer different questions.Exam cue: Check the stated conditions, the mathematical relationship and the worked values together.
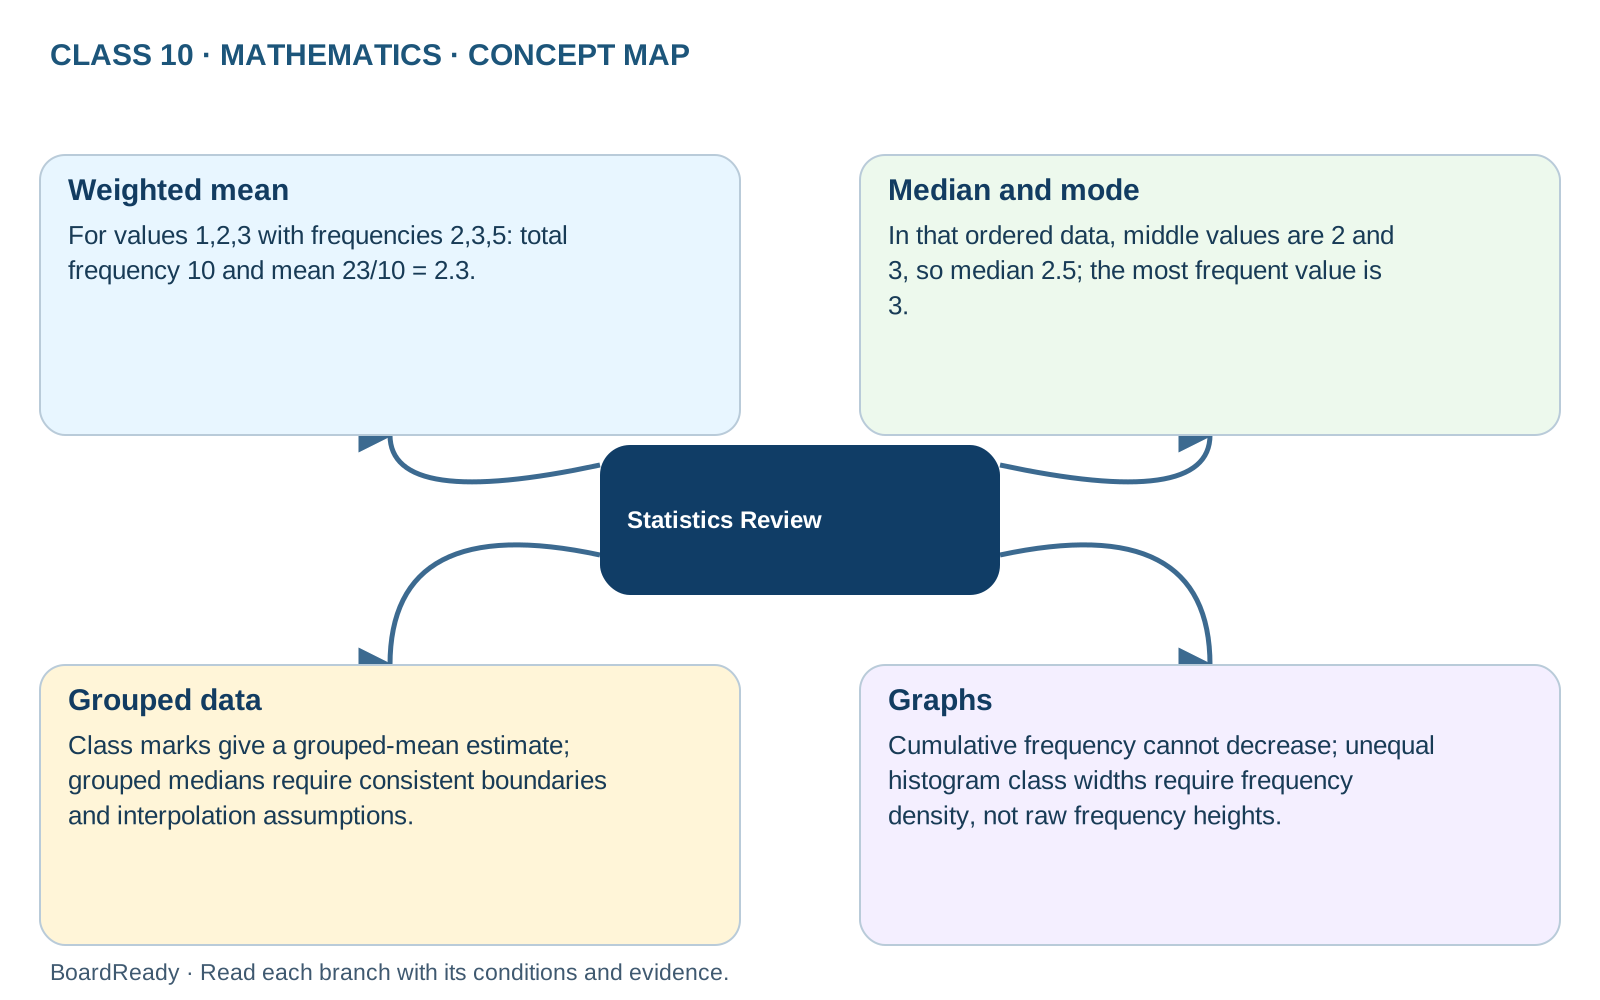
- 1Statistics Review -> Weighted mean: For values 1,2,3 with frequencies 2,3,5: total frequency 10 and mean 23/10 = 2.3.
- 2Statistics Review -> Median and mode: In that ordered data, middle values are 2 and 3, so median 2.5; the most frequent value is 3.
- 3Statistics Review -> Grouped data: Class marks give a grouped-mean estimate; grouped medians require consistent boundaries and interpolation assumptions.
- 4Statistics Review -> Graphs: Cumulative frequency cannot decrease; unequal histogram class widths require frequency density, not raw frequency heights.